| May 2025 | Jun 2025 | Jul 2025 | ||||
|---|---|---|---|---|---|---|
| Sunday | Monday | Tuesday | Wednesday | Thursday | Friday | Saturday |
| 01 High: 59.979202 Low: 43.419178 Precip: M Avg Wind: N @ 2.3 Gust: 10 (6:30 PM) RH% Min/Max: 11-46 Feel Min/Max: 43 to 60 | 02 High: 51.299618 Low: 37.810383 Precip: M Avg Wind: WNW @ 3.9 Gust: 15 (4:20 PM) RH% Min/Max: 14-51 Feel Min/Max: 34 to 51 | 03 High: 40.73 Low: 29.609583 Precip: M Avg Wind: WNW @ 4.8 Gust: 15 (7:50 AM) RH% Min/Max: 22-44 Feel Min/Max: 23 to 40 | 04 High: 46.65921 Low: 29.40079 Precip: M Avg Wind: WSW @ 4.2 Gust: 13 (12:50 PM) RH% Min/Max: 27-54 Feel Min/Max: 26 to 44 | 05 High: 46.830215 Low: 31.209797 Precip: M Avg Wind: WSW @ 3.8 Gust: 14 (12:50 PM) RH% Min/Max: 19-61 Feel Min/Max: 31 to 44 | 06 High: 45.879787 Low: 31.010012 Precip: M Avg Wind: W @ 4.1 Gust: 18 (3:00 PM) RH% Min/Max: 26-79 Feel Min/Max: 29 to 44 | 07 High: 51.400417 Low: 37.11918 Precip: M Avg Wind: W @ 4.4 Gust: 14 (2:10 PM) RH% Min/Max: 25-38 Feel Min/Max: 34 to 51 |
| 08 High: 55.689808 Low: 42.310383 Precip: M Avg Wind: NW @ 3.5 Gust: 14 (2:30 PM) RH% Min/Max: 20-50 Feel Min/Max: 41 to 56 | 09 High: 58.429413 Low: 42.909798 Precip: M Avg Wind: N @ 2.7 Gust: 12 (1:30 AM) RH% Min/Max: 9-54 Feel Min/Max: 40 to 58 | 10 High: 59.869392 Low: 44.709797 Precip: M Avg Wind: NW @ 2.6 Gust: 14 (3:50 PM) RH% Min/Max: 13-42 Feel Min/Max: 44 to 60 | 11 High: 59.88922 Low: 43.649616 Precip: M Avg Wind: SW @ 4.0 Gust: 19 (6:10 PM) RH% Min/Max: 18-51 Feel Min/Max: 44 to 60 | 12 High: 59.23938 Low: 45.039223 Precip: M Avg Wind: SW @ 4.5 Gust: 15 (3:30 PM) RH% Min/Max: 13-51 Feel Min/Max: 44 to 59 | 13 High: 60.279785 Low: 44.400204 Precip: M Avg Wind: SW @ 4.8 Gust: 15 (3:10 PM) RH% Min/Max: 11-28 Feel Min/Max: 42 to 60 | 14 High: 60.54082 Low: 43.9808 Precip: M Avg Wind: SW @ 3.7 Gust: 15 (4:30 PM) RH% Min/Max: 6-24 Feel Min/Max: 43 to 61 |
| 15 High: 61.179787 Low: 46.21998 Precip: M Avg Wind: SW @ 4.8 Gust: 17 (4:50 PM) RH% Min/Max: 5-19 Feel Min/Max: 46 to 61 | 16 High: 59.979202 Low: 45.49999 Precip: M Avg Wind: WSW @ 4.3 Gust: 21 (5:10 PM) RH% Min/Max: 6-27 Feel Min/Max: 45 to 60 | 17 High: 51.81982 Low: 44.200417 Precip: M Gust: 16 (12:50 PM) RH% Min/Max: 12-26 Feel Min/Max: 43 to 52 | 18 Precip: M | 19 | 20 | 21 |
| 22 | 23 | 24 | 25 | 26 | 27 | 28 |
| 29 | 30 | 01 | 02 | 03 | 04 | 05 |
The data presented here provided by IEM API webservice: daily.json. A simple CSV option exists as well.
Daily High/Low Plot
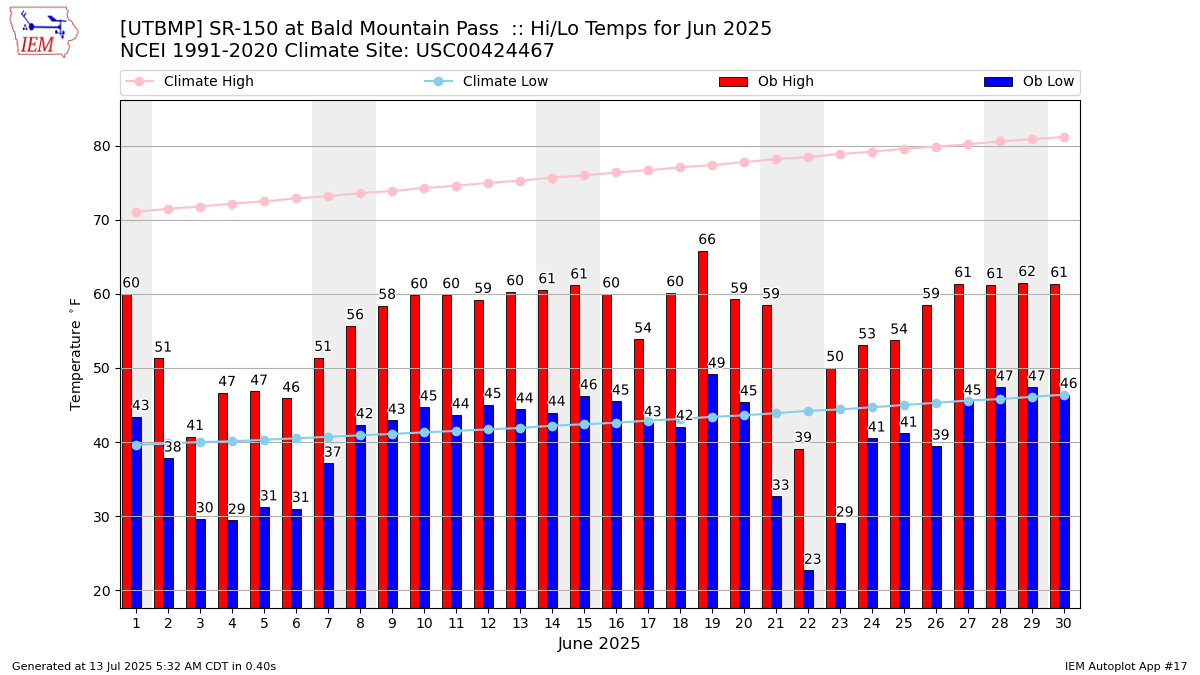
Description: This chart of the monthly temperature data. The bars are the observations and the dots are climatology.
Daily Rainfall
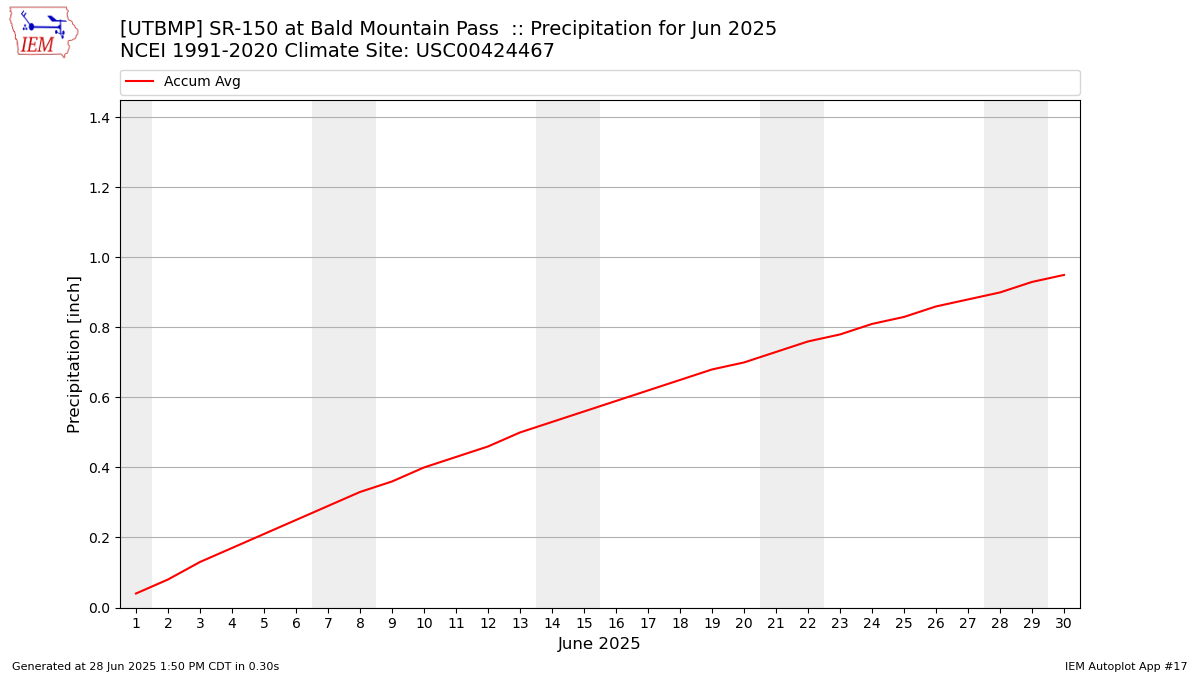
Description: This chart is of daily precipitation for the month. The red line would be an average month while the blue line and bars are observations.
Daily Average Wind Speeds
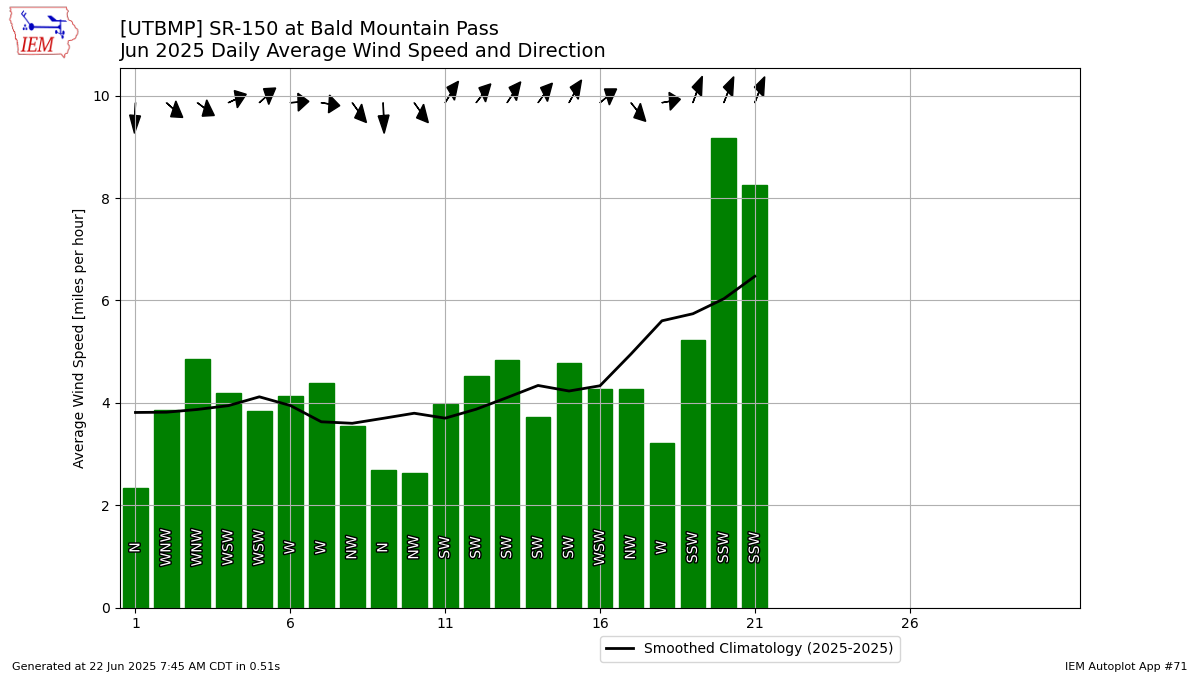
Description: This chart is of the daily average wind speeds.
The data presented here provided by IEM API webservice: daily.json. A simple CSV option exists as well.