| May 2025 | Jun 2025 | Jul 2025 | ||||
|---|---|---|---|---|---|---|
| Sunday | Monday | Tuesday | Wednesday | Thursday | Friday | Saturday |
| 01 High: 88.59919 Low: 42.569607 Precip: M Avg Wind: N @ 3.4 Gust: 19 (4:50 PM) RH% Min/Max: 11-85 Feel Min/Max: 43 to 85 | 02 High: 76.74978 Low: 50.91982 Precip: M Avg Wind: NW @ 4.7 Gust: 22 (3:00 PM) RH% Min/Max: 13-70 Feel Min/Max: 51 to 77 | 03 High: 67.26918 Low: 36.39919 Precip: M Avg Wind: NW @ 4.9 Gust: 26 (1:50 PM) RH% Min/Max: 18-83 Feel Min/Max: 35 to 67 | 04 High: 73.569176 Low: 36.370407 Precip: M Avg Wind: NW @ 4.7 Gust: 28 (5:50 PM) RH% Min/Max: 17-82 Feel Min/Max: 36 to 74 | 05 High: 73.979576 Low: 35.94018 Precip: M Avg Wind: NNW @ 3.7 Gust: 23 (5:40 PM) RH% Min/Max: 16-84 Feel Min/Max: 36 to 74 | 06 High: 73.999405 Low: 39.9308 Precip: M Avg Wind: WNW @ 3.8 Gust: 30 (2:40 PM) RH% Min/Max: 16-79 Feel Min/Max: 40 to 74 | 07 High: 78.920616 Low: 40.870407 Precip: M Avg Wind: NW @ 3.8 Gust: 22 (2:20 PM) RH% Min/Max: 17-76 Feel Min/Max: 41 to 79 |
| 08 High: 83.699615 Low: 42.299618 Precip: M Avg Wind: NNW @ 4.1 Gust: 27 (2:20 PM) RH% Min/Max: 13-84 Feel Min/Max: 41 to 81 | 09 High: 88.500206 Low: 43.759426 Precip: M Avg Wind: ESE @ 1.6 Gust: 11 (3:10 PM) RH% Min/Max: 6-86 Feel Min/Max: 44 to 84 | 10 High: 86.39962 Low: 47.800415 Precip: M Avg Wind: NNW @ 4.1 Gust: 33 (1:20 PM) RH% Min/Max: 15-75 Feel Min/Max: 48 to 83 | 11 High: 89.99962 Low: 49.89919 Precip: M Avg Wind: WNW @ 4.1 Gust: 26 (4:50 PM) RH% Min/Max: 14-74 Feel Min/Max: 50 to 86 | 12 High: 87.20058 Low: 51.679413 Precip: M Avg Wind: NW @ 3.6 Gust: 23 (2:20 PM) RH% Min/Max: 13-75 Feel Min/Max: 52 to 84 | 13 High: 88.300415 Low: 46.180428 Precip: M Avg Wind: SSW @ 4.0 Gust: 26 (4:10 PM) RH% Min/Max: 8-79 Feel Min/Max: 46 to 84 | 14 High: 89.2994 Low: 44.4308 Precip: M Avg Wind: SSW @ 3.7 Gust: 22 (2:20 PM) RH% Min/Max: 8-76 Feel Min/Max: 43 to 85 |
| 15 High: 89.799774 Low: 44.479416 Precip: M Avg Wind: NW @ 3.7 Gust: 26 (12:30 PM) RH% Min/Max: 8-78 Feel Min/Max: 44 to 85 | 16 High: 61.660385 Low: 42.560596 Precip: M Gust: 7 (9:10 AM) RH% Min/Max: 38-79 Feel Min/Max: 41 to 62 | 17 Precip: M | 18 | 19 | 20 | 21 |
| 22 | 23 | 24 | 25 | 26 | 27 | 28 |
| 29 | 30 | 01 | 02 | 03 | 04 | 05 |
The data presented here provided by IEM API webservice: daily.json. A simple CSV option exists as well.
Daily High/Low Plot
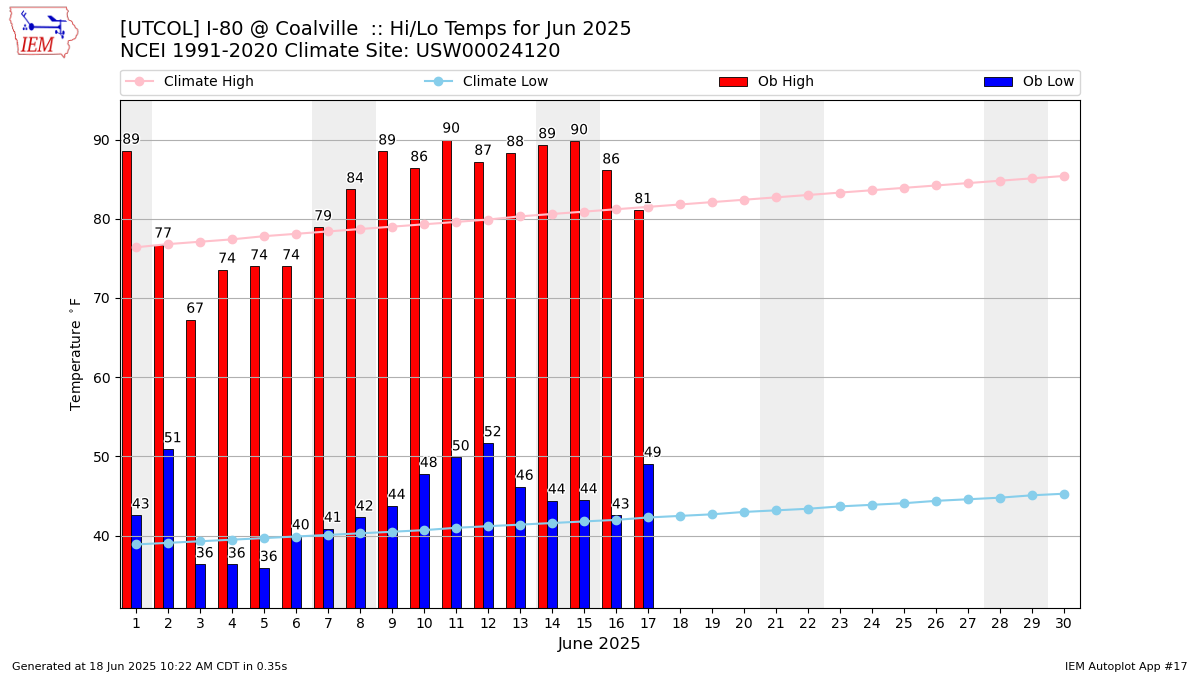
Description: This chart of the monthly temperature data. The bars are the observations and the dots are climatology.
Daily Rainfall
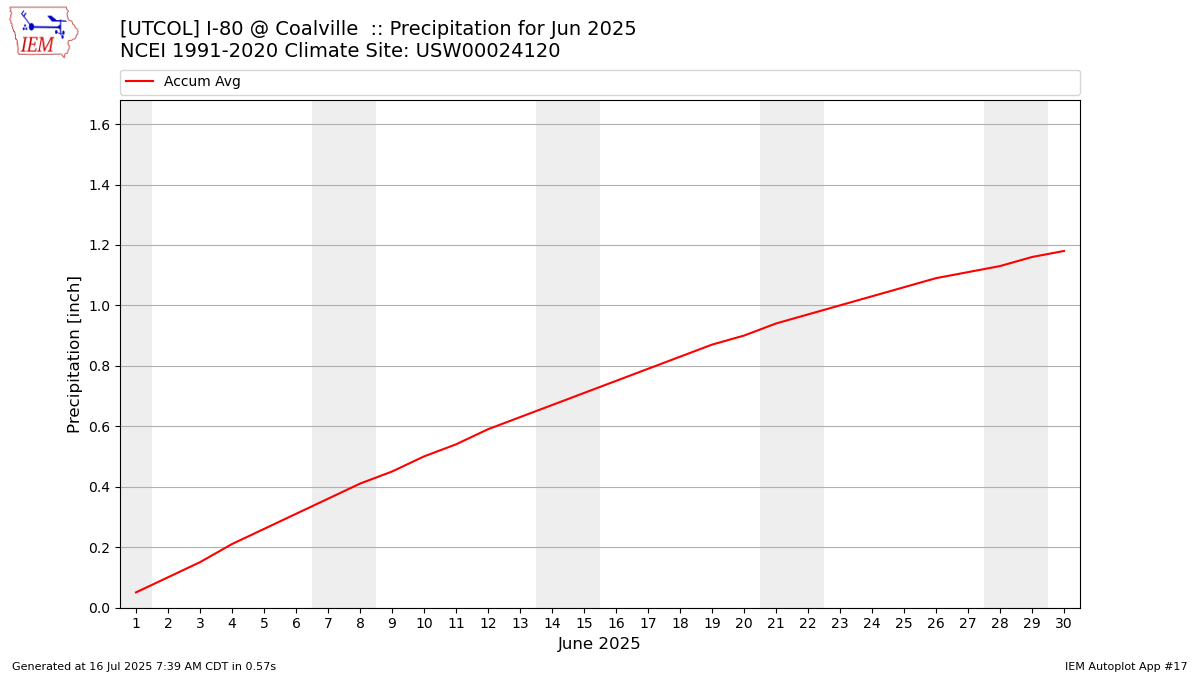
Description: This chart is of daily precipitation for the month. The red line would be an average month while the blue line and bars are observations.
Daily Average Wind Speeds
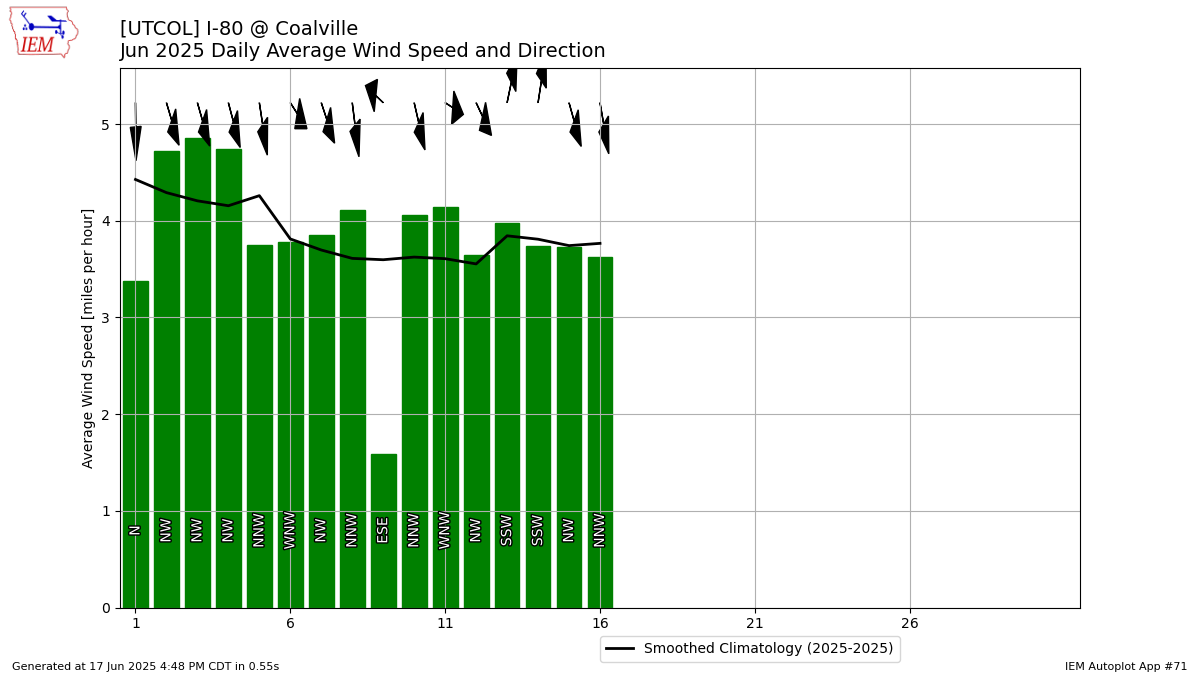
Description: This chart is of the daily average wind speeds.
The data presented here provided by IEM API webservice: daily.json. A simple CSV option exists as well.