| May 2025 | Jun 2025 | Jul 2025 | ||||
|---|---|---|---|---|---|---|
| Sunday | Monday | Tuesday | Wednesday | Thursday | Friday | Saturday |
| 01 High: 89.2994 Low: 42.24919 Precip: M Avg Wind: SW @ 2.9 Gust: 17 (3:50 PM) RH% Min/Max: 13-89 Feel Min/Max: 41 to 86 | 02 High: 76.71918 Low: 48.660812 Precip: M Avg Wind: NW @ 3.5 Gust: 23 (3:30 PM) RH% Min/Max: 14-73 Feel Min/Max: 49 to 77 | 03 High: 67.839806 Low: 37.18938 Precip: M Avg Wind: NW @ 3.3 Gust: 25 (1:50 PM) RH% Min/Max: 22-86 Feel Min/Max: 34 to 68 | 04 High: 72.719604 Low: 34.9106 Precip: M Avg Wind: NNW @ 3.5 Gust: 23 (3:30 PM) RH% Min/Max: 22-86 Feel Min/Max: 32 to 73 | 05 High: 73.779785 Low: 35.209427 Precip: M Avg Wind: NNW @ 3.2 Gust: 20 (2:50 PM) RH% Min/Max: 19-84 Feel Min/Max: 34 to 74 | 06 High: 74.89941 Low: 38.780586 Precip: M Avg Wind: S @ 3.7 Gust: 23 (3:30 PM) RH% Min/Max: 17-80 Feel Min/Max: 34 to 75 | 07 High: 80.20042 Low: 38.879627 Precip: M Avg Wind: S @ 2.9 Gust: 19 (2:50 PM) RH% Min/Max: 20-83 Feel Min/Max: 36 to 80 |
| 08 High: 84.39983 Low: 41.570618 Precip: M Avg Wind: W @ 3.3 Gust: 18 (2:20 PM) RH% Min/Max: 18-87 Feel Min/Max: 38 to 82 | 09 High: 87.09978 Low: 44.299404 Precip: M Avg Wind: SSE @ 2.5 Gust: 11 (2:10 AM) RH% Min/Max: 8-87 Feel Min/Max: 43 to 83 | 10 High: 87.09978 Low: 43.849403 Precip: M Avg Wind: WSW @ 3.2 Gust: 20 (4:20 PM) RH% Min/Max: 18-84 Feel Min/Max: 44 to 84 | 11 High: 91.70058 Low: 47.76982 Precip: M Avg Wind: NNE @ 3.8 Gust: 28 (4:00 PM) RH% Min/Max: 17-82 Feel Min/Max: 46 to 88 | 12 High: 87.99978 Low: 49.240395 Precip: M Avg Wind: SE @ 3.3 Gust: 24 (5:20 PM) RH% Min/Max: 17-84 Feel Min/Max: 48 to 84 | 13 High: 88.300415 Low: 46.959797 Precip: M Avg Wind: SE @ 3.5 Gust: 26 (3:20 PM) RH% Min/Max: 11-84 Feel Min/Max: 46 to 84 | 14 High: 89.00063 Low: 44.000576 Precip: M Avg Wind: N @ 3.3 Gust: 22 (2:00 PM) RH% Min/Max: 11-79 Feel Min/Max: 41 to 85 |
| 15 High: 89.70079 Low: 44.160812 Precip: M Avg Wind: NNW @ 3.4 Gust: 21 (2:50 PM) RH% Min/Max: 12-81 Feel Min/Max: 42 to 86 | 16 High: 85.8002 Low: 42.200577 Precip: M Avg Wind: WNW @ 3.1 Gust: 19 (4:30 PM) RH% Min/Max: 16-78 Feel Min/Max: 42 to 83 | 17 High: 61.919605 Low: 55.270405 Precip: M Gust: 11 (1:20 AM) RH% Min/Max: 41-52 Feel Min/Max: 55 to 62 | 18 Precip: M | 19 | 20 | 21 |
| 22 | 23 | 24 | 25 | 26 | 27 | 28 |
| 29 | 30 | 01 | 02 | 03 | 04 | 05 |
The data presented here provided by IEM API webservice: daily.json. A simple CSV option exists as well.
Daily High/Low Plot
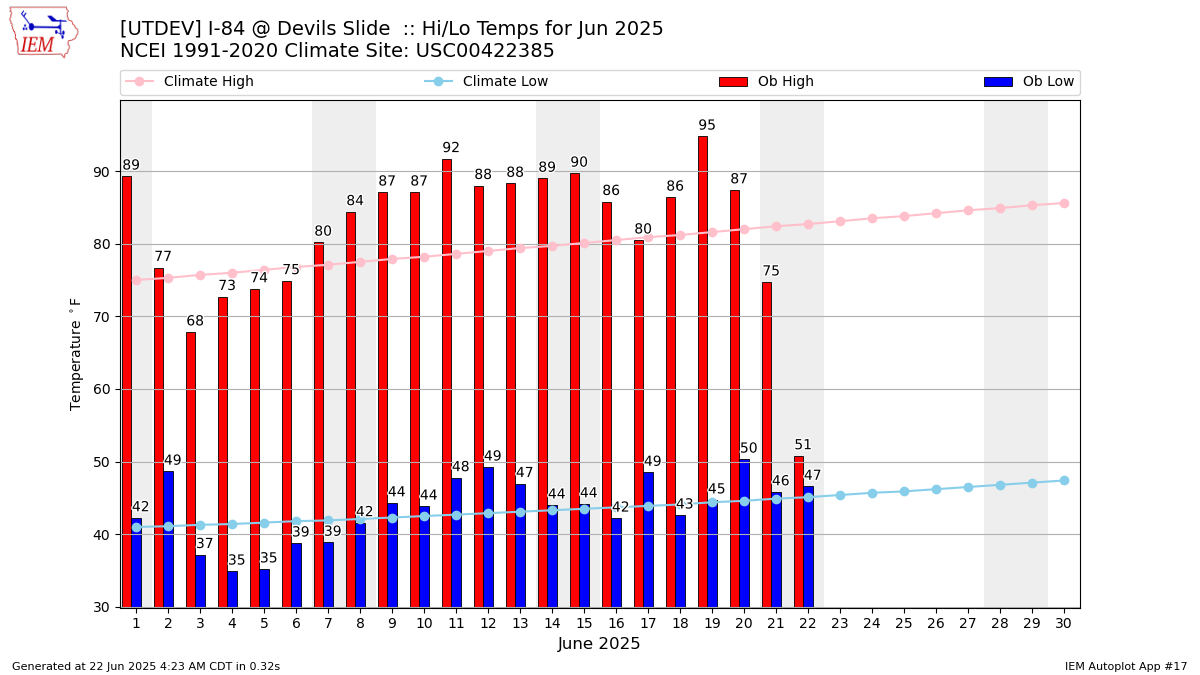
Description: This chart of the monthly temperature data. The bars are the observations and the dots are climatology.
Daily Rainfall
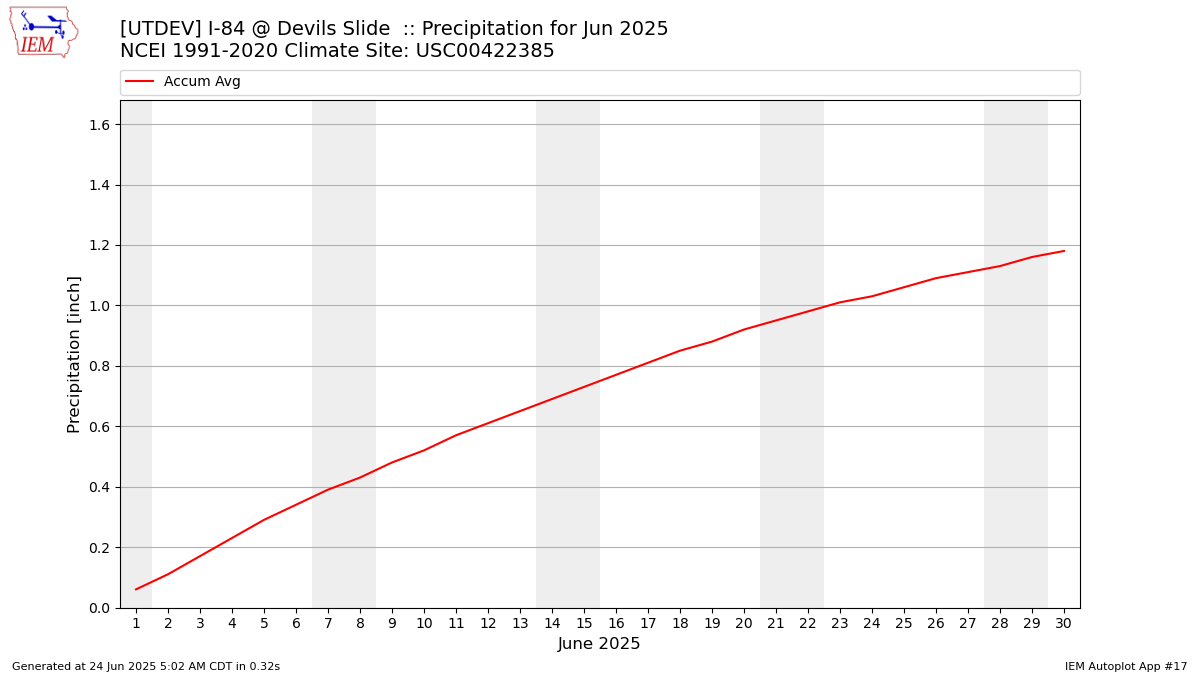
Description: This chart is of daily precipitation for the month. The red line would be an average month while the blue line and bars are observations.
Daily Average Wind Speeds
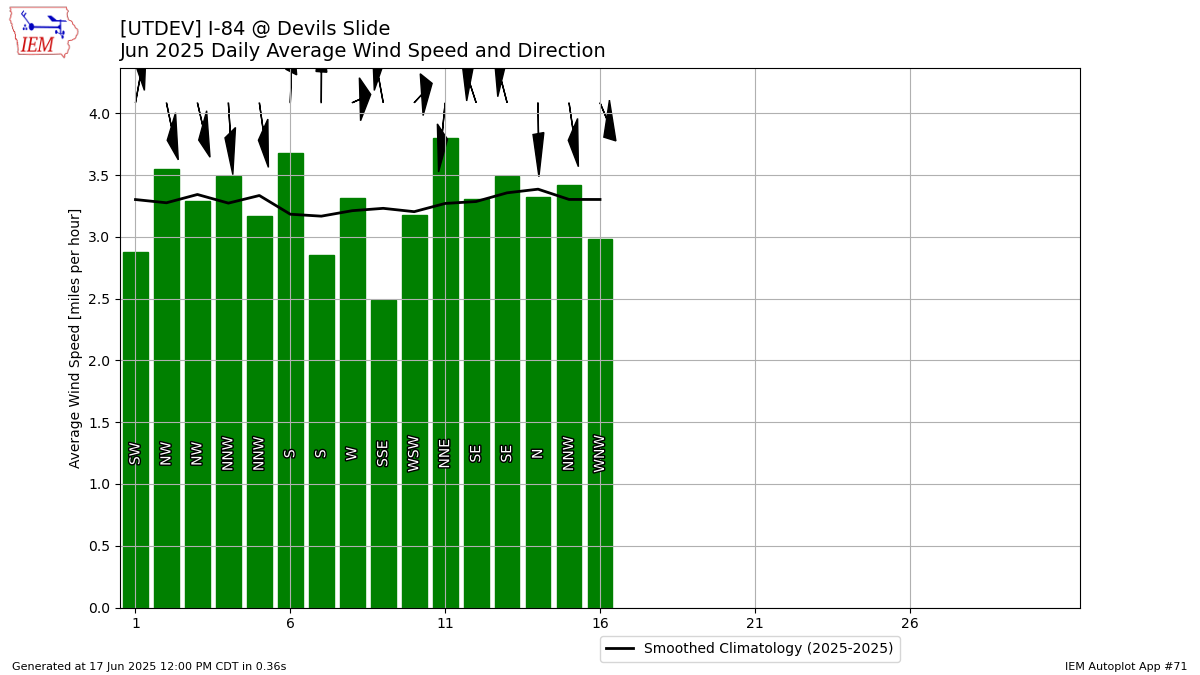
Description: This chart is of the daily average wind speeds.
The data presented here provided by IEM API webservice: daily.json. A simple CSV option exists as well.