| May 2025 | Jun 2025 | Jul 2025 | ||||
|---|---|---|---|---|---|---|
| Sunday | Monday | Tuesday | Wednesday | Thursday | Friday | Saturday |
| 01 High: 89.799774 Low: 47.370193 Precip: M Avg Wind: SSW @ 6.9 Gust: 35 (4:10 PM) RH% Min/Max: 10-68 Feel Min/Max: 47 to 85 | 02 High: 78.36982 Low: 61.959213 Precip: M Avg Wind: SSW @ 8.1 Gust: 27 (7:10 PM) RH% Min/Max: 23-56 Feel Min/Max: 62 to 78 | 03 High: 74.98043 Low: 41.570618 Precip: M Avg Wind: NE @ 4.2 Gust: 18 (3:40 PM) RH% Min/Max: 13-88 Feel Min/Max: 42 to 75 | 04 High: 75.880424 Low: 39.36918 Precip: M Avg Wind: WSW @ 5.4 Gust: 23 (5:50 PM) RH% Min/Max: 19-67 Feel Min/Max: 39 to 76 | 05 High: 75.19999 Low: 55.839222 Precip: M Avg Wind: SSW @ 10.6 Gust: 30 (1:00 PM) RH% Min/Max: 28-72 Feel Min/Max: 56 to 75 | 06 High: 80.00063 Low: 46.470192 Precip: M Avg Wind: SW @ 5.2 Gust: 24 (6:00 PM) RH% Min/Max: 21-84 Feel Min/Max: 46 to 80 | 07 High: 84.50063 Low: 43.05921 Precip: M Avg Wind: ESE @ 4.6 Gust: 19 (4:10 PM) RH% Min/Max: 13-80 Feel Min/Max: 43 to 81 |
| 08 High: 87.299614 Low: 43.930428 Precip: M Avg Wind: NNE @ 3.8 Gust: 23 (2:20 PM) RH% Min/Max: 11-64 Feel Min/Max: 44 to 84 | 09 High: 88.300415 Low: 44.659424 Precip: M Avg Wind: NNE @ 4.3 Gust: 20 (12:00 PM) RH% Min/Max: 7-69 Feel Min/Max: 45 to 84 | 10 High: 91.29919 Low: 44.259796 Precip: M Avg Wind: NW @ 3.7 Gust: 31 (7:30 PM) RH% Min/Max: 10-65 Feel Min/Max: 44 to 86 | 11 High: 91.0994 Low: 64.669975 Precip: M Avg Wind: SSW @ 8.2 Gust: 34 (4:30 PM) RH% Min/Max: 8-37 Feel Min/Max: 65 to 86 | 12 High: 90.10042 Low: 59.88922 Precip: M Avg Wind: SSW @ 8.1 Gust: 29 (2:30 PM) RH% Min/Max: 8-32 Feel Min/Max: 60 to 85 | 13 High: 89.799774 Low: 65.78059 Precip: M Avg Wind: SSW @ 11.4 Gust: 38 (4:20 PM) RH% Min/Max: 8-18 Feel Min/Max: 66 to 85 | 14 High: 69.659584 Low: 66.95058 Precip: M Gust: 15 (12:10 AM) RH% Min/Max: 15-17 Feel Min/Max: 67 to 70 |
| 15 Precip: M | 16 | 17 | 18 | 19 | 20 | 21 |
| 22 | 23 | 24 | 25 | 26 | 27 | 28 |
| 29 | 30 | 01 | 02 | 03 | 04 | 05 |
The data presented here provided by IEM API webservice: daily.json. A simple CSV option exists as well.
Daily High/Low Plot
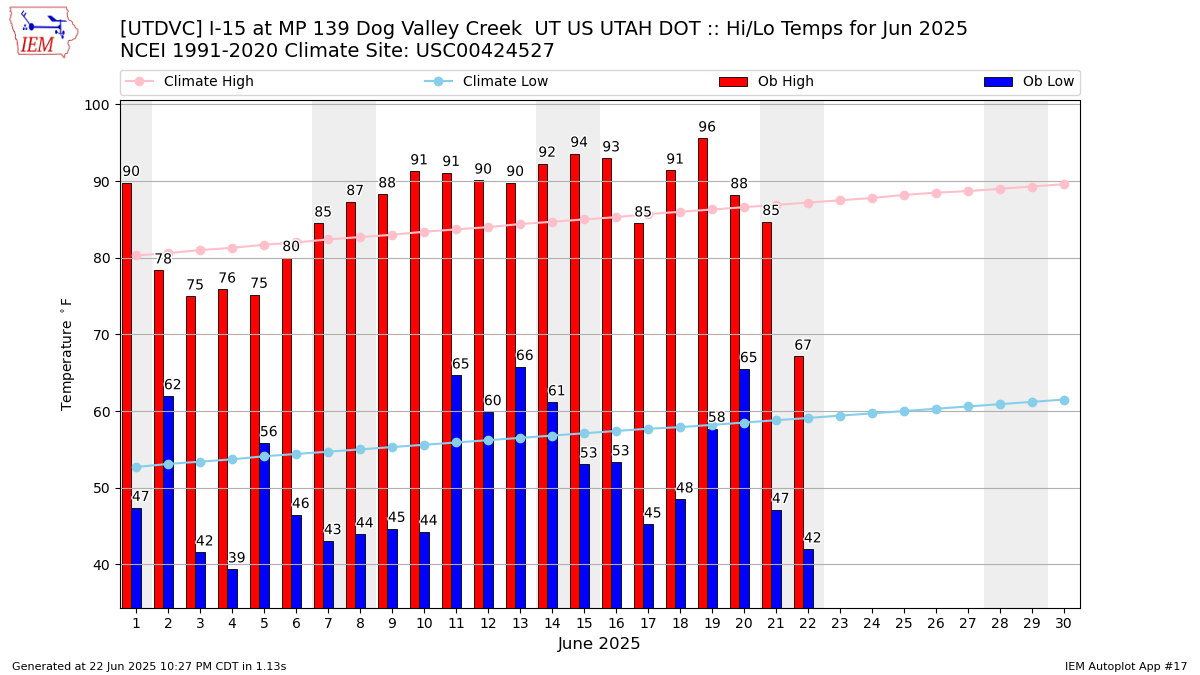
Description: This chart of the monthly temperature data. The bars are the observations and the dots are climatology.
Daily Rainfall
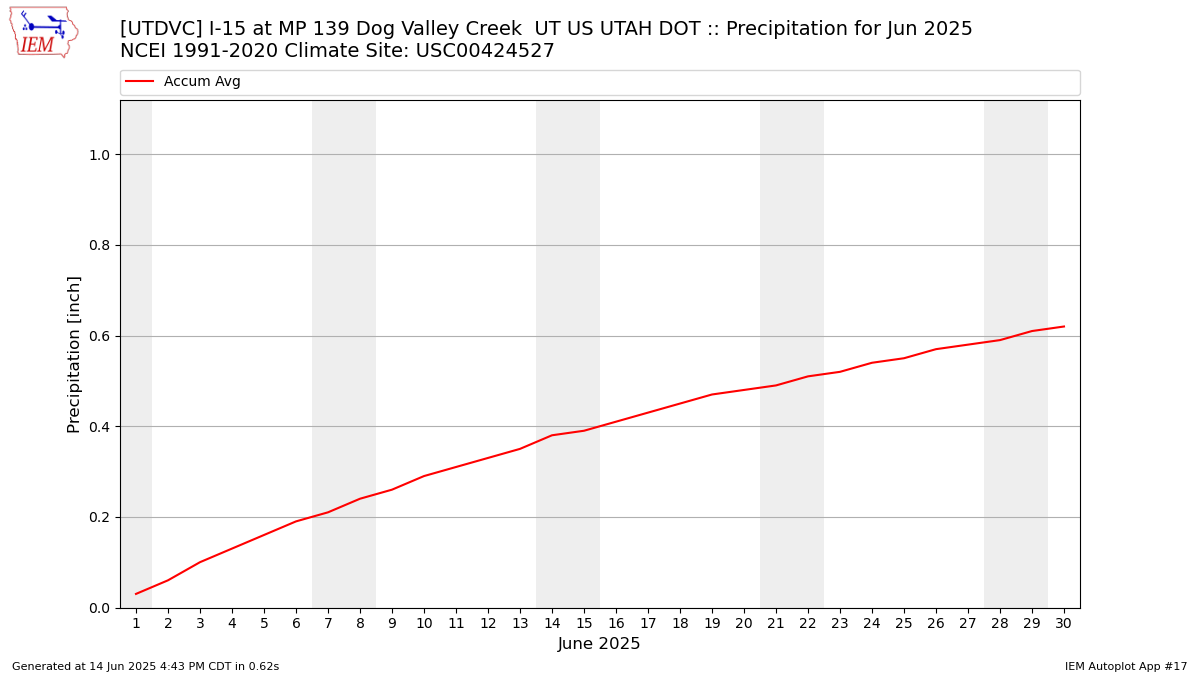
Description: This chart is of daily precipitation for the month. The red line would be an average month while the blue line and bars are observations.
Daily Average Wind Speeds
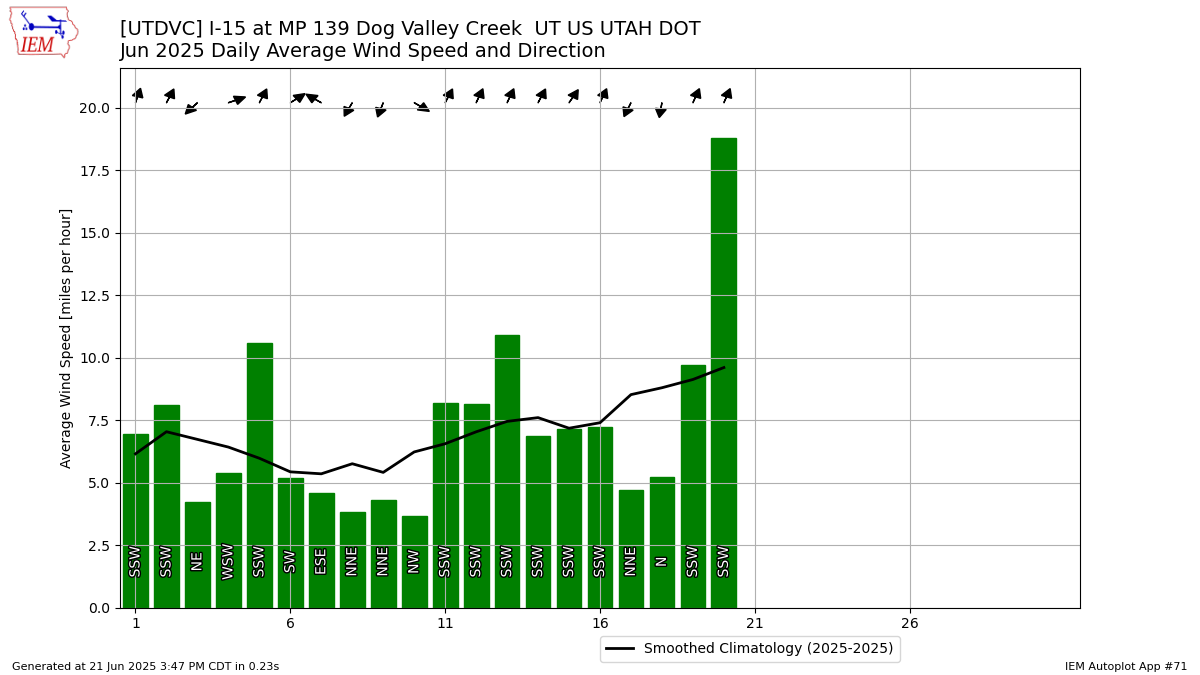
Description: This chart is of the daily average wind speeds.
The data presented here provided by IEM API webservice: daily.json. A simple CSV option exists as well.