| May 2025 | Jun 2025 | Jul 2025 | ||||
|---|---|---|---|---|---|---|
| Sunday | Monday | Tuesday | Wednesday | Thursday | Friday | Saturday |
| 01 High: 86.50042 Low: 46.009426 Precip: M Avg Wind: SW @ 4.3 Gust: 43 (10:00 PM) RH% Min/Max: 11-71 Feel Min/Max: 45 to 83 | 02 High: 72.73043 Low: 41.090023 Precip: M Avg Wind: SW @ 5.0 Gust: 19 (5:05 PM) RH% Min/Max: 14-73 Feel Min/Max: 39 to 73 | 03 High: 66.70042 Low: 34.210384 Precip: M Avg Wind: SW @ 4.3 Gust: 24 (1:50 PM) RH% Min/Max: 18-78 Feel Min/Max: 31 to 67 | 04 High: 68.9396 Low: 34.559586 Precip: M Avg Wind: SW @ 4.7 Gust: 18 (1:10 PM) RH% Min/Max: 23-82 Feel Min/Max: 32 to 69 | 05 High: 70.930374 Low: 35.99061 Precip: M Avg Wind: WSW @ 3.9 Gust: 17 (2:10 PM) RH% Min/Max: 21-73 Feel Min/Max: 33 to 71 | 06 High: 73.020195 Low: 38.69061 Precip: M Avg Wind: SW @ 4.4 Gust: 26 (5:00 PM) RH% Min/Max: 16-78 Feel Min/Max: 35 to 73 | 07 High: 77.71998 Low: 41.480587 Precip: M Avg Wind: SSW @ 4.0 Gust: 20 (4:20 PM) RH% Min/Max: 18-70 Feel Min/Max: 39 to 78 |
| 08 High: 80.70079 Low: 45.140022 Precip: M Avg Wind: SSW @ 4.0 Gust: 22 (3:10 PM) RH% Min/Max: 16-76 Feel Min/Max: 43 to 80 | 09 High: 83.100204 Low: 44.920406 Precip: M Avg Wind: SE @ 3.3 Gust: 15 (8:35 AM) RH% Min/Max: 14-81 Feel Min/Max: 43 to 81 | 10 High: 84.09919 Low: 45.370407 Precip: M Avg Wind: SSW @ 3.9 Gust: 19 (3:20 PM) RH% Min/Max: 17-72 Feel Min/Max: 43 to 81 | 11 High: 88.300415 Low: 50.610226 Precip: M Avg Wind: SSW @ 4.9 Gust: 25 (4:20 PM) RH% Min/Max: 13-69 Feel Min/Max: 51 to 84 | 12 High: 84.9002 Low: 54.3308 Precip: M Avg Wind: ESE @ 5.4 Gust: 24 (1:20 PM) RH% Min/Max: 14-64 Feel Min/Max: 54 to 82 | 13 High: 85.99999 Low: 46.549404 Precip: M Avg Wind: SSW @ 4.4 Gust: 24 (4:05 PM) RH% Min/Max: 7-78 Feel Min/Max: 45 to 83 | 14 High: 87.299614 Low: 45.6098 Precip: M Avg Wind: SW @ 4.3 Gust: 20 (2:35 PM) RH% Min/Max: 8-60 Feel Min/Max: 43 to 83 |
| 15 High: 87.69919 Low: 48.259426 Precip: M Avg Wind: WSW @ 4.0 Gust: 21 (2:20 PM) RH% Min/Max: 8-65 Feel Min/Max: 47 to 84 | 16 High: 83.49978 Low: 46.18938 Precip: M Avg Wind: SW @ 3.5 Gust: 17 (2:20 PM) RH% Min/Max: 13-60 Feel Min/Max: 45 to 81 | 17 High: 71.4002 Low: 47.01918 Precip: M Gust: 14 (10:15 AM) RH% Min/Max: 26-63 Feel Min/Max: 46 to 71 | 18 Precip: M | 19 | 20 | 21 |
| 22 | 23 | 24 | 25 | 26 | 27 | 28 |
| 29 | 30 | 01 | 02 | 03 | 04 | 05 |
The data presented here provided by IEM API webservice: daily.json. A simple CSV option exists as well.
Daily High/Low Plot
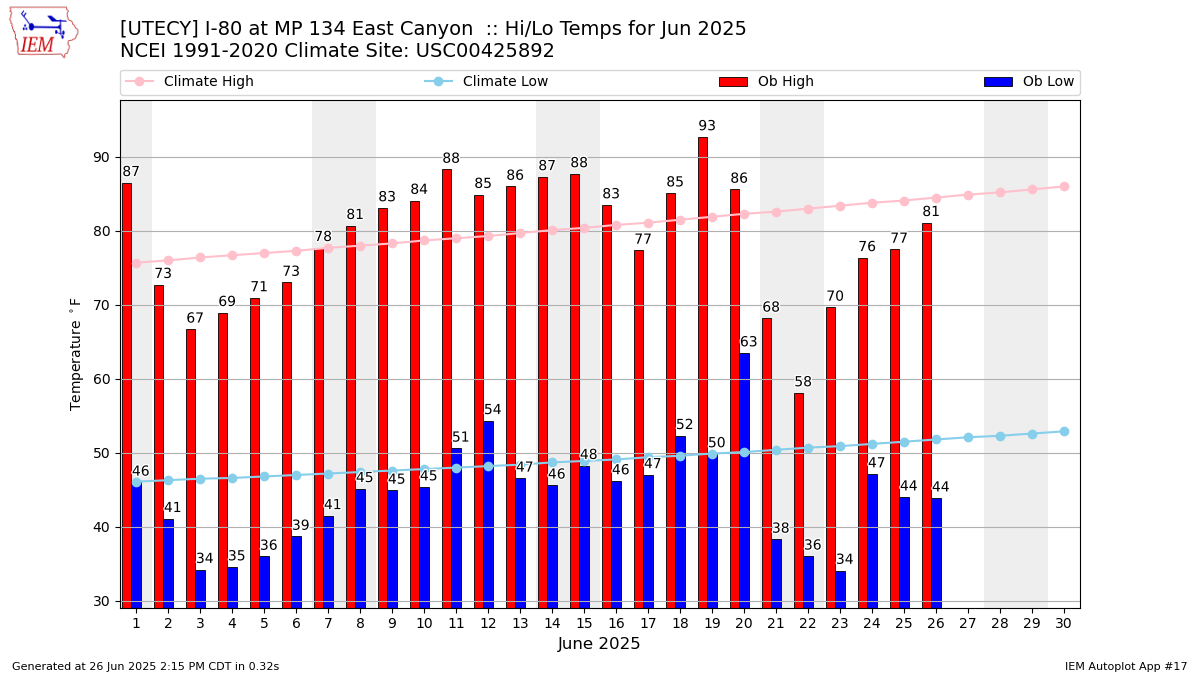
Description: This chart of the monthly temperature data. The bars are the observations and the dots are climatology.
Daily Rainfall

Description: This chart is of daily precipitation for the month. The red line would be an average month while the blue line and bars are observations.
Daily Average Wind Speeds
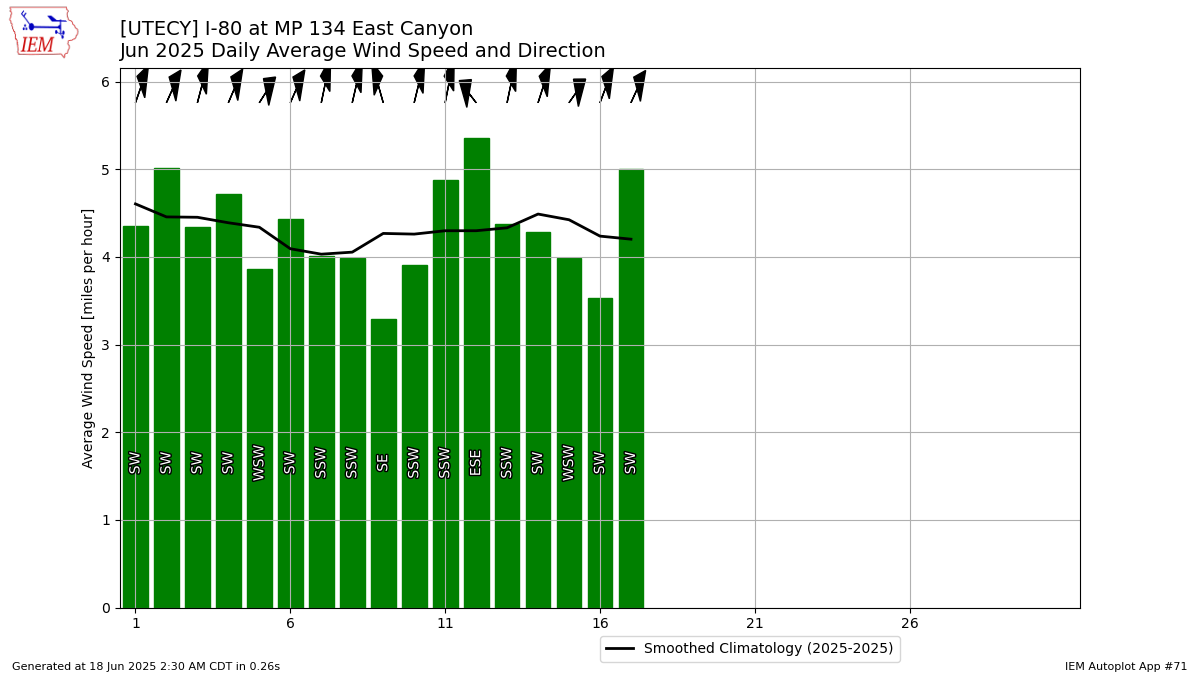
Description: This chart is of the daily average wind speeds.
The data presented here provided by IEM API webservice: daily.json. A simple CSV option exists as well.