| May 2025 | Jun 2025 | Jul 2025 | ||||
|---|---|---|---|---|---|---|
| Sunday | Monday | Tuesday | Wednesday | Thursday | Friday | Saturday |
| 01 High: 91.799614 Low: 54.289383 Precip: M Avg Wind: NE @ 8.0 Gust: 28 (6:30 PM) RH% Min/Max: 12-45 Feel Min/Max: 54 to 88 | 02 High: 80.00063 Low: 65.5502 Precip: M Avg Wind: NNE @ 12.0 Gust: 30 (4:20 PM) RH% Min/Max: 12-44 Feel Min/Max: 66 to 80 | 03 High: 75.64999 Low: 53.709797 Precip: M Avg Wind: NW @ 9.5 Gust: 28 (12:20 PM) RH% Min/Max: 16-31 Feel Min/Max: 54 to 76 | 04 High: 74.40079 Low: 52.71081 Precip: M Avg Wind: NNE @ 7.7 Gust: 21 (4:00 PM) RH% Min/Max: 18-35 Feel Min/Max: 53 to 74 | 05 High: 77.689384 Low: 49.249405 Precip: M Avg Wind: NE @ 6.0 Gust: 22 (4:10 PM) RH% Min/Max: 18-48 Feel Min/Max: 46 to 78 | 06 High: 82.39999 Low: 57.2792 Precip: M Avg Wind: E @ 5.9 Gust: 21 (3:20 PM) RH% Min/Max: 14-54 Feel Min/Max: 57 to 80 | 07 High: 87.600204 Low: 55.540394 Precip: M Avg Wind: ENE @ 6.7 Gust: 22 (12:10 PM) RH% Min/Max: 15-43 Feel Min/Max: 56 to 83 |
| 08 High: 88.89983 Low: 54.140022 Precip: M Avg Wind: ENE @ 6.8 Gust: 27 (5:30 PM) RH% Min/Max: 17-42 Feel Min/Max: 54 to 85 | 09 High: 91.500786 Low: 55.97062 Precip: M Avg Wind: NE @ 6.2 Gust: 20 (5:10 PM) RH% Min/Max: 5-49 Feel Min/Max: 56 to 86 | 10 High: 91.799614 Low: 58.980213 Precip: M Avg Wind: NE @ 7.6 Gust: 30 (12:40 PM) RH% Min/Max: 16-43 Feel Min/Max: 59 to 88 | 11 High: 98.09962 Low: 59.89999 Precip: M Avg Wind: NW @ 11.4 Gust: 39 (7:10 PM) RH% Min/Max: 10-46 Feel Min/Max: 60 to 92 | 12 High: 93.7994 Low: 63.96982 Precip: M Avg Wind: NNE @ 8.4 Gust: 28 (11:30 PM) RH% Min/Max: 12-56 Feel Min/Max: 64 to 90 | 13 High: 93.70042 Low: 60.9494 Precip: M Avg Wind: W @ 8.0 Gust: 26 (2:30 PM) RH% Min/Max: 6-54 Feel Min/Max: 61 to 88 | 14 High: 91.799614 Low: 59.71998 Precip: M Avg Wind: NE @ 8.5 Gust: 24 (2:50 PM) RH% Min/Max: 12-46 Feel Min/Max: 60 to 88 |
| 15 High: 95.300575 Low: 56.49082 Precip: M Avg Wind: WSW @ 7.3 Gust: 26 (6:20 PM) RH% Min/Max: 6-46 Feel Min/Max: 56 to 89 | 16 High: 89.90057 Low: 54.699776 Precip: M Avg Wind: NE @ 6.5 Gust: 26 (6:00 PM) RH% Min/Max: 7-36 Feel Min/Max: 55 to 86 | 17 High: 76.8002 Low: 69.130424 Precip: M Gust: 26 (4:20 AM) RH% Min/Max: 15-28 Feel Min/Max: 69 to 77 | 18 Precip: M | 19 | 20 | 21 |
| 22 | 23 | 24 | 25 | 26 | 27 | 28 |
| 29 | 30 | 01 | 02 | 03 | 04 | 05 |
The data presented here provided by IEM API webservice: daily.json. A simple CSV option exists as well.
Daily High/Low Plot
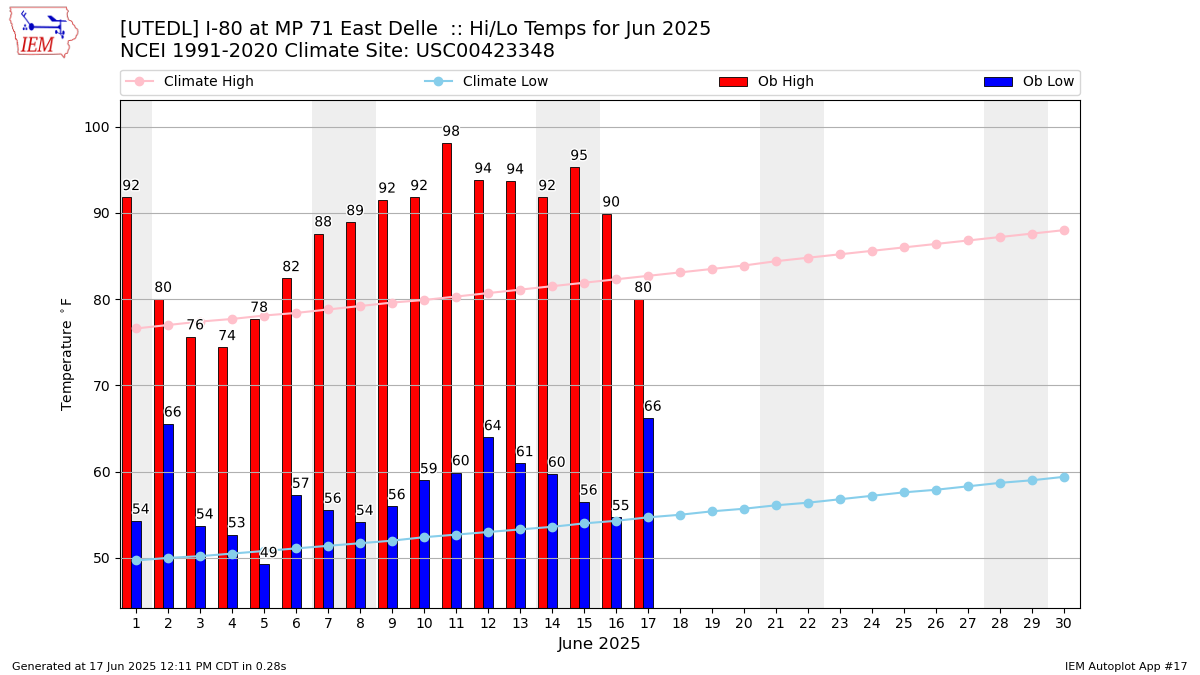
Description: This chart of the monthly temperature data. The bars are the observations and the dots are climatology.
Daily Rainfall
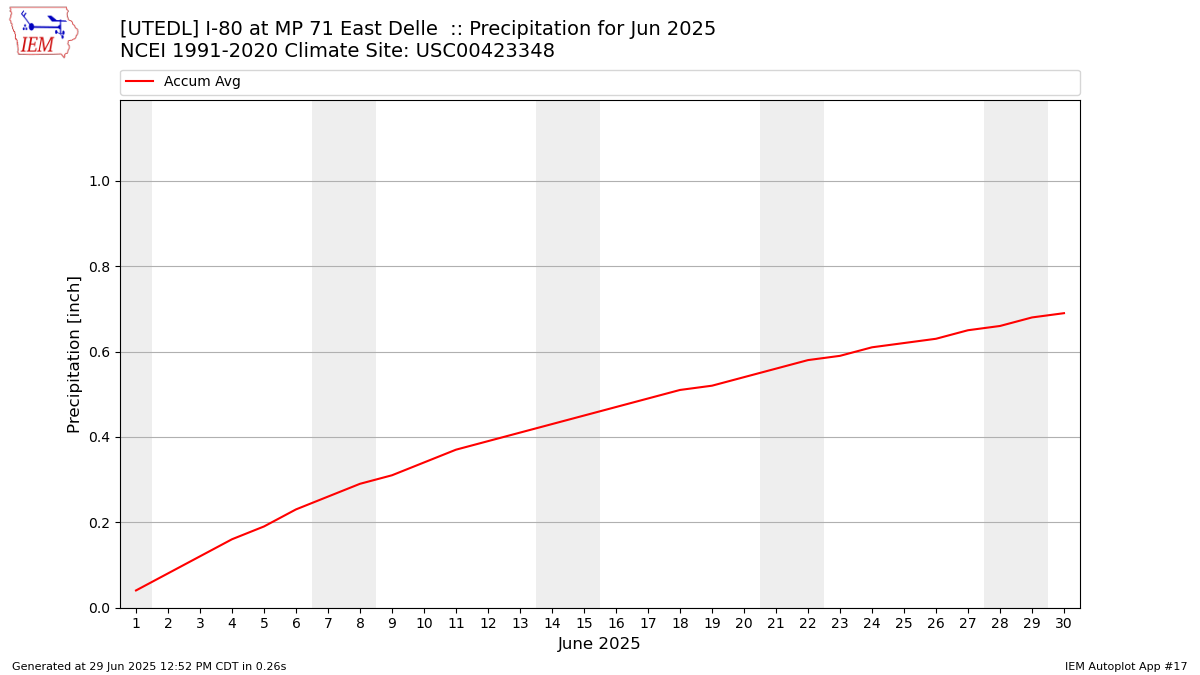
Description: This chart is of daily precipitation for the month. The red line would be an average month while the blue line and bars are observations.
Daily Average Wind Speeds
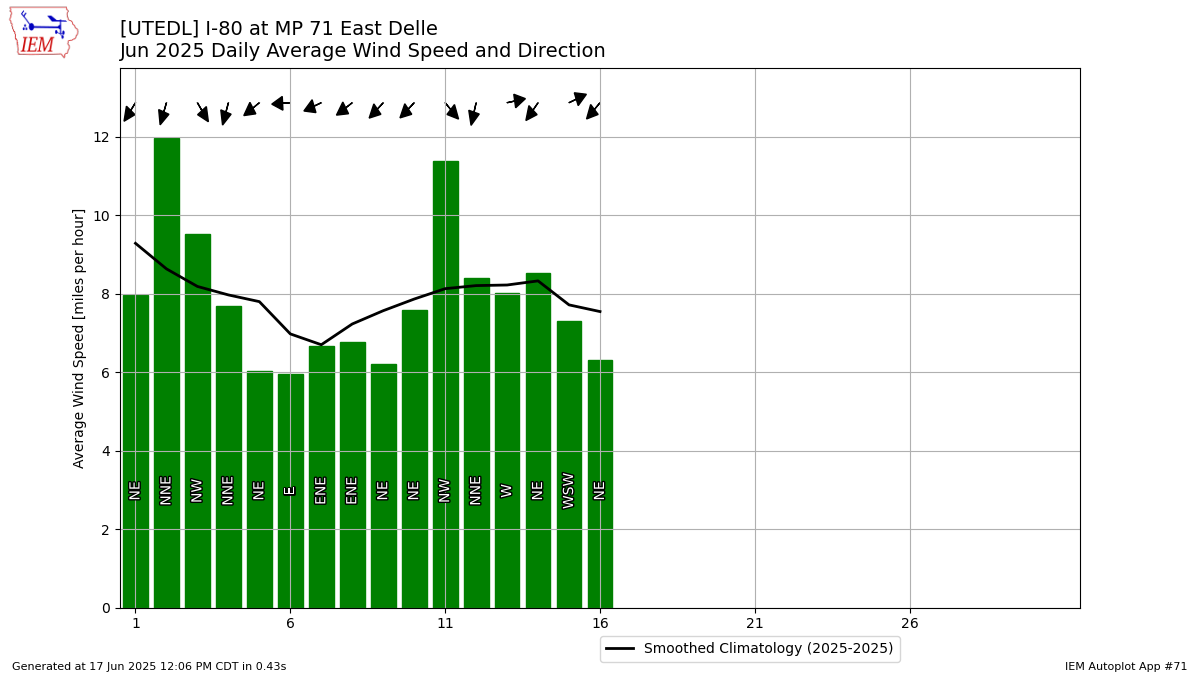
Description: This chart is of the daily average wind speeds.
The data presented here provided by IEM API webservice: daily.json. A simple CSV option exists as well.