| May 2025 | Jun 2025 | Jul 2025 | ||||
|---|---|---|---|---|---|---|
| Sunday | Monday | Tuesday | Wednesday | Thursday | Friday | Saturday |
| 01 High: 87.499405 Low: 40.49061 Precip: M Avg Wind: SSW @ 3.4 Gust: 15 (5:40 PM) RH% Min/Max: 14-80 Feel Min/Max: 40 to 84 | 02 High: 78.85943 Low: 51.44002 Precip: M Avg Wind: N @ 7.0 Gust: 28 (7:20 PM) RH% Min/Max: 15-69 Feel Min/Max: 51 to 79 | 03 High: 69.13938 Low: 38.170406 Precip: M Avg Wind: NNW @ 4.9 Gust: 23 (7:00 PM) RH% Min/Max: 16-70 Feel Min/Max: 38 to 69 | 04 High: 73.36939 Low: 36.260597 Precip: M Avg Wind: SSW @ 5.2 Gust: 23 (2:30 PM) RH% Min/Max: 21-71 Feel Min/Max: 33 to 73 | 05 High: 72.66918 Low: 42.839596 Precip: M Avg Wind: N @ 5.3 Gust: 21 (6:40 PM) RH% Min/Max: 26-68 Feel Min/Max: 41 to 73 | 06 High: 74.800415 Low: 41.669605 Precip: M Avg Wind: NNW @ 3.7 Gust: 24 (4:20 PM) RH% Min/Max: 19-77 Feel Min/Max: 40 to 75 | 07 High: 79.98981 Low: 38.260384 Precip: M Avg Wind: NNW @ 3.6 Gust: 16 (7:20 PM) RH% Min/Max: 17-77 Feel Min/Max: 38 to 80 |
| 08 High: 84.000206 Low: 42.72078 Precip: M Avg Wind: N @ 4.3 Gust: 24 (3:00 PM) RH% Min/Max: 14-78 Feel Min/Max: 43 to 81 | 09 High: 85.89919 Low: 44.13922 Precip: M Avg Wind: N @ 3.5 Gust: 17 (4:00 PM) RH% Min/Max: 10-80 Feel Min/Max: 43 to 82 | 10 High: 85.99999 Low: 44.27062 Precip: M Avg Wind: NNW @ 3.5 Gust: 17 (4:20 PM) RH% Min/Max: 15-71 Feel Min/Max: 44 to 83 | 11 High: 88.199615 Low: 44.61081 Precip: M Avg Wind: S @ 6.3 Gust: 53 (7:30 PM) RH% Min/Max: 13-80 Feel Min/Max: 45 to 85 | 12 High: 86.50042 Low: 52.959213 Precip: M Avg Wind: SSW @ 6.3 Gust: 26 (12:10 AM) RH% Min/Max: 11-69 Feel Min/Max: 53 to 83 | 13 High: 85.99999 Low: 45.649403 Precip: M Avg Wind: SSW @ 5.7 Gust: 21 (3:10 PM) RH% Min/Max: 12-69 Feel Min/Max: 46 to 83 | 14 High: 85.99999 Low: 46.49002 Precip: M Gust: 23 (3:30 PM) RH% Min/Max: 12-66 Feel Min/Max: 45 to 83 |
| 15 Precip: M | 16 | 17 | 18 | 19 | 20 | 21 |
| 22 | 23 | 24 | 25 | 26 | 27 | 28 |
| 29 | 30 | 01 | 02 | 03 | 04 | 05 |
The data presented here provided by IEM API webservice: daily.json. A simple CSV option exists as well.
Daily High/Low Plot
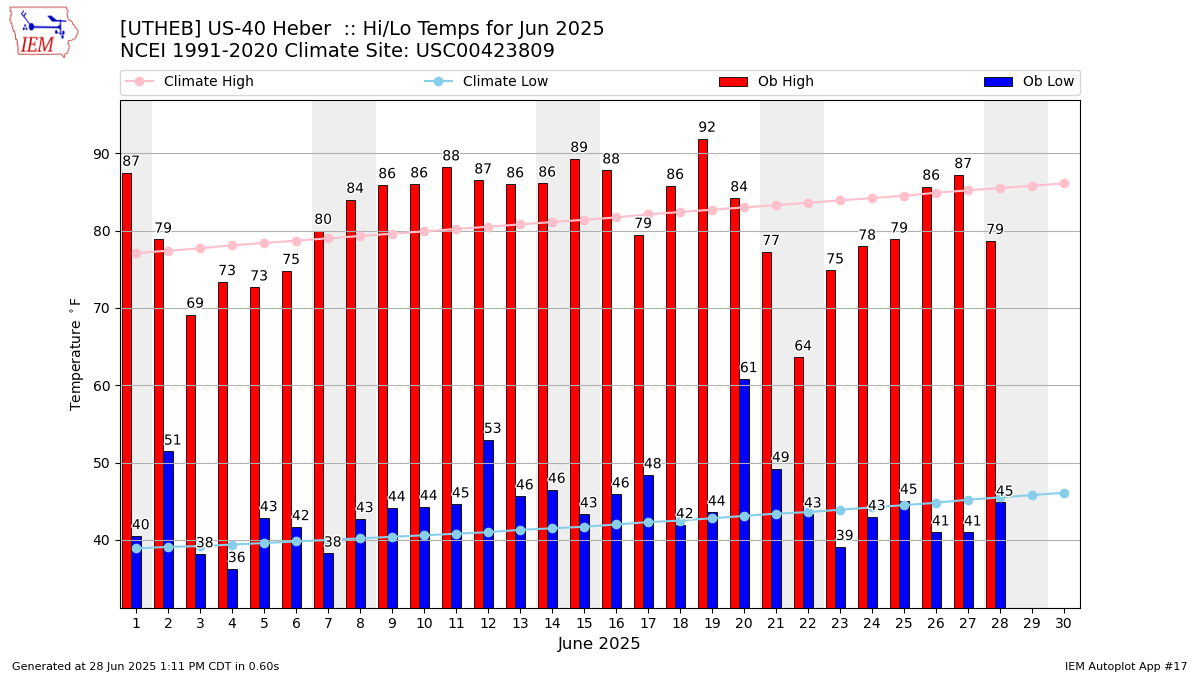
Description: This chart of the monthly temperature data. The bars are the observations and the dots are climatology.
Daily Rainfall
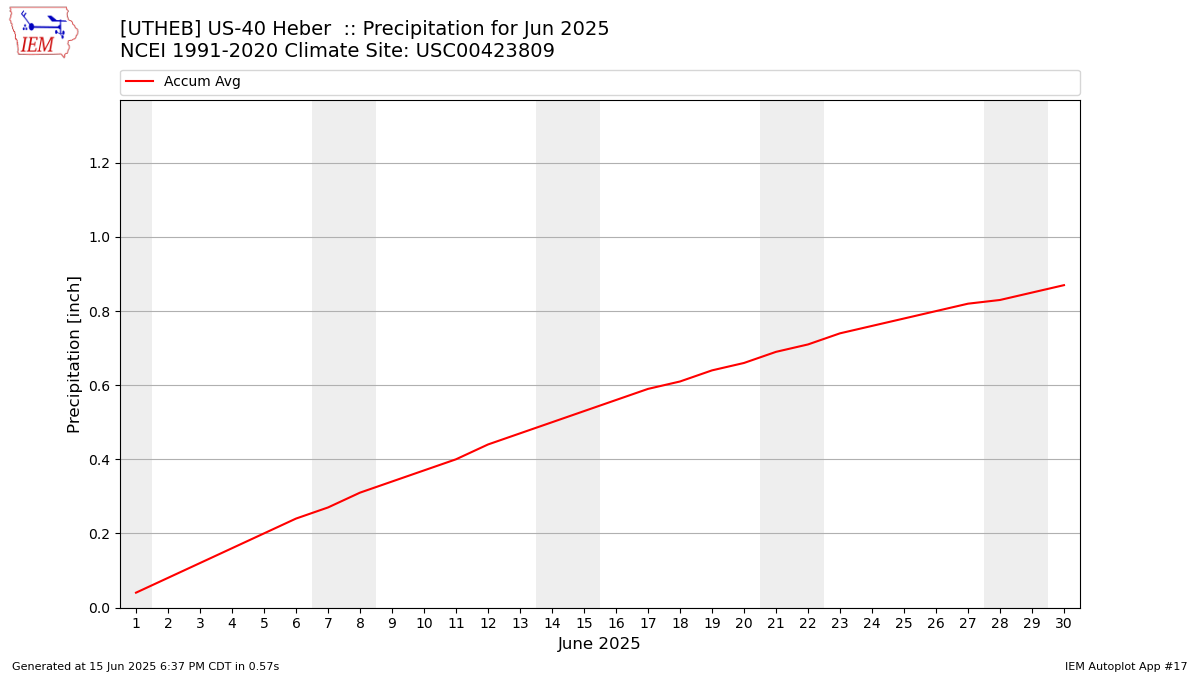
Description: This chart is of daily precipitation for the month. The red line would be an average month while the blue line and bars are observations.
Daily Average Wind Speeds
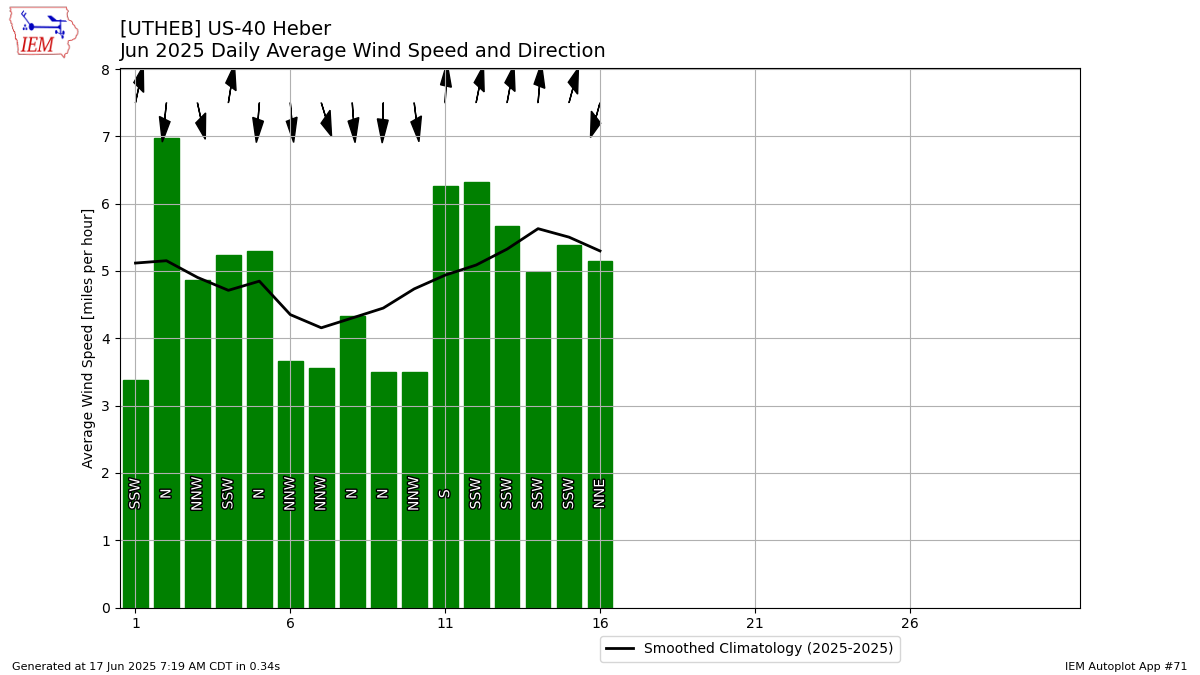
Description: This chart is of the daily average wind speeds.
The data presented here provided by IEM API webservice: daily.json. A simple CSV option exists as well.