| May 2025 | Jun 2025 | Jul 2025 | ||||
|---|---|---|---|---|---|---|
| Sunday | Monday | Tuesday | Wednesday | Thursday | Friday | Saturday |
| 01 High: 90.10042 Low: 56.19919 Precip: M Avg Wind: NNW @ 4.2 Gust: 21 (9:30 PM) RH% Min/Max: 11-62 Feel Min/Max: 56 to 86 | 02 High: 76.64002 Low: 58.719177 Precip: M Avg Wind: NW @ 5.5 Gust: 25 (5:00 AM) RH% Min/Max: 15-53 Feel Min/Max: 59 to 77 | 03 High: 69.42019 Low: 50.840607 Precip: M Avg Wind: NNW @ 4.4 Gust: 19 (1:20 PM) RH% Min/Max: 17-51 Feel Min/Max: 51 to 69 | 04 High: 71.8196 Low: 48.799404 Precip: M Avg Wind: NW @ 4.7 Gust: 16 (3:20 PM) RH% Min/Max: 16-56 Feel Min/Max: 49 to 72 | 05 High: 74.890396 Low: 48.09919 Precip: M Avg Wind: N @ 4.1 Gust: 15 (3:40 PM) RH% Min/Max: 16-63 Feel Min/Max: 46 to 75 | 06 High: 77.34018 Low: 53.760223 Precip: M Avg Wind: NNE @ 4.2 Gust: 17 (4:00 PM) RH% Min/Max: 15-54 Feel Min/Max: 54 to 77 | 07 High: 82.0994 Low: 51.929573 Precip: M Avg Wind: ENE @ 4.4 Gust: 13 (4:30 PM) RH% Min/Max: 16-68 Feel Min/Max: 52 to 80 |
| 08 High: 85.09999 Low: 54.210224 Precip: M Avg Wind: NNW @ 3.0 Gust: 13 (4:20 PM) RH% Min/Max: 13-67 Feel Min/Max: 54 to 82 | 09 High: 87.499405 Low: 56.64919 Precip: M Avg Wind: NW @ 3.9 Gust: 14 (3:00 AM) RH% Min/Max: 11-73 Feel Min/Max: 57 to 84 | 10 High: 88.80079 Low: 58.609425 Precip: M Avg Wind: NNE @ 3.7 Gust: 12 (3:00 PM) RH% Min/Max: 14-63 Feel Min/Max: 59 to 85 | 11 High: 94.60042 Low: 59.500416 Precip: M Avg Wind: WSW @ 6.1 Gust: 26 (7:30 PM) RH% Min/Max: 14-59 Feel Min/Max: 60 to 90 | 12 High: 88.199615 Low: 57.360226 Precip: M Avg Wind: N @ 4.6 Gust: 15 (1:40 AM) RH% Min/Max: 19-74 Feel Min/Max: 57 to 85 | 13 High: 91.70058 Low: 62.25079 Precip: M Avg Wind: SW @ 5.3 Gust: 23 (3:50 PM) RH% Min/Max: 9-64 Feel Min/Max: 62 to 87 | 14 High: 94.60042 Low: 67.49061 Precip: M Avg Wind: S @ 5.3 Gust: 18 (11:40 AM) RH% Min/Max: 9-47 Feel Min/Max: 67 to 89 |
| 15 High: 90.39919 Low: 59.439224 Precip: M Avg Wind: N @ 5.1 Gust: 15 (2:10 PM) RH% Min/Max: 9-69 Feel Min/Max: 59 to 86 | 16 Precip: M | 17 Precip: M | 18 | 19 | 20 | 21 |
| 22 | 23 | 24 | 25 | 26 | 27 | 28 |
| 29 | 30 | 01 | 02 | 03 | 04 | 05 |
The data presented here provided by IEM API webservice: daily.json. A simple CSV option exists as well.
Daily High/Low Plot
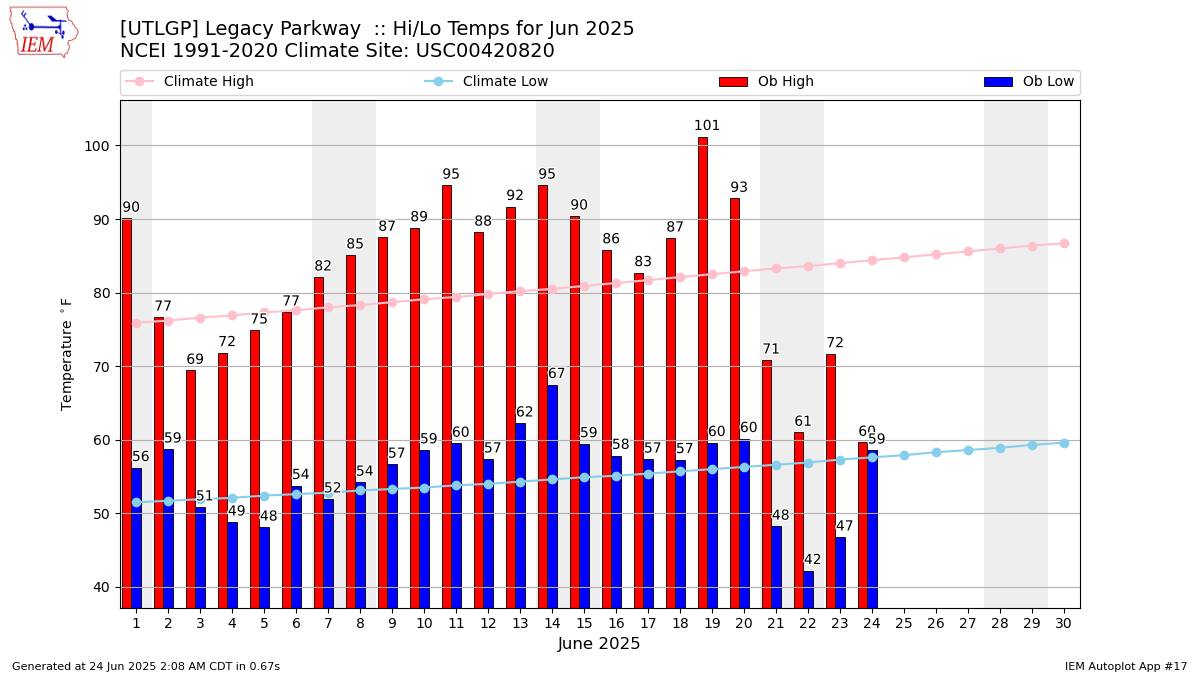
Description: This chart of the monthly temperature data. The bars are the observations and the dots are climatology.
Daily Rainfall
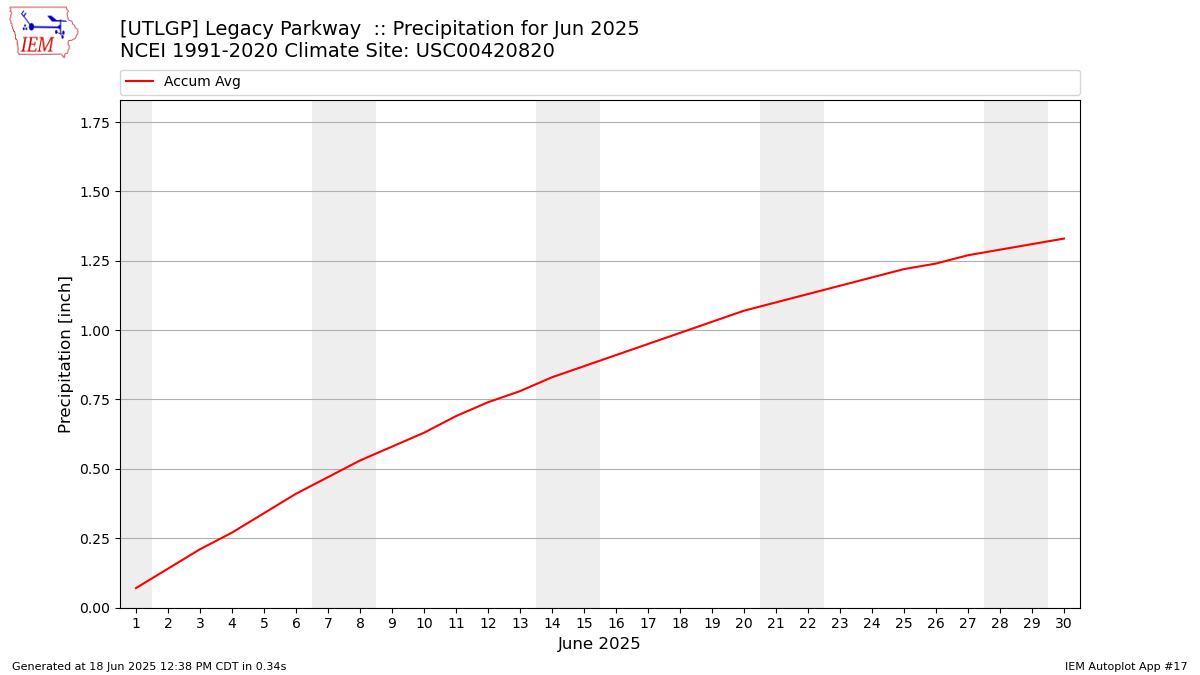
Description: This chart is of daily precipitation for the month. The red line would be an average month while the blue line and bars are observations.
Daily Average Wind Speeds
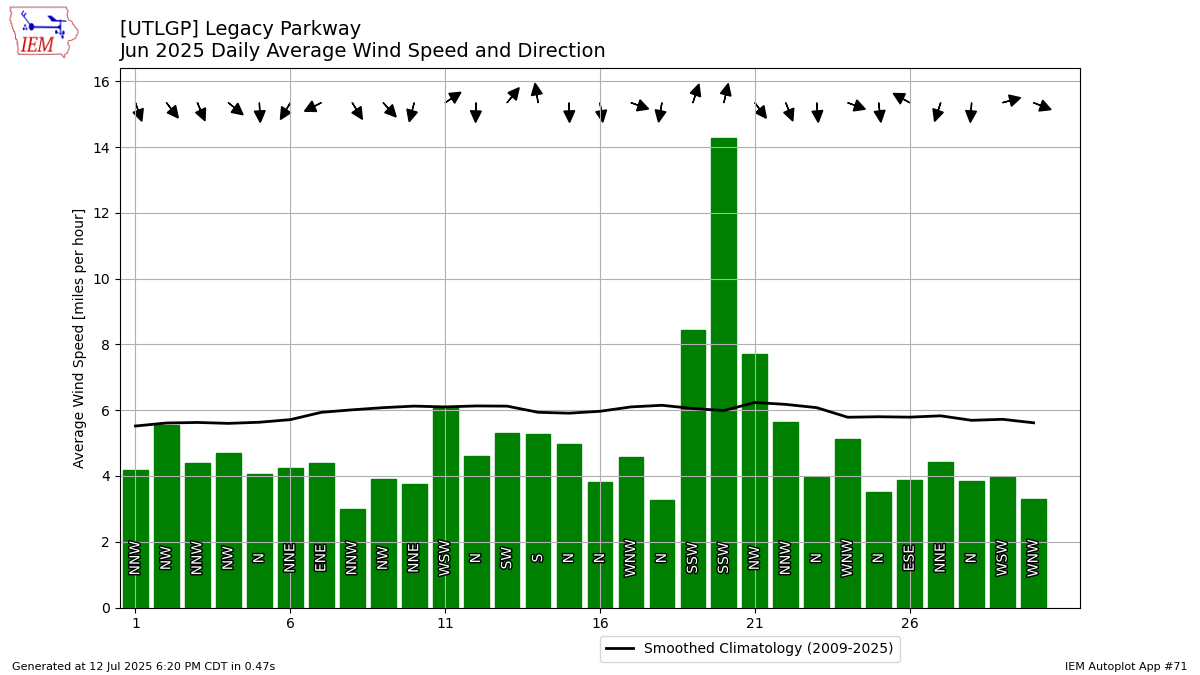
Description: This chart is of the daily average wind speeds.
The data presented here provided by IEM API webservice: daily.json. A simple CSV option exists as well.