| May 2025 | Jun 2025 | Jul 2025 | ||||
|---|---|---|---|---|---|---|
| Sunday | Monday | Tuesday | Wednesday | Thursday | Friday | Saturday |
| 01 High: 92.800415 Low: 47.800415 Precip: M Avg Wind: NW @ 4.9 Gust: 32 (6:30 PM) RH% Min/Max: 16-81 Feel Min/Max: 46 to 89 | 02 High: 75.95058 Low: 49.710224 Precip: M Avg Wind: NW @ 11.0 Gust: 29 (9:30 AM) RH% Min/Max: 13-48 Feel Min/Max: 50 to 76 | 03 High: 73.889595 Low: 39.27019 Precip: M Avg Wind: NW @ 4.6 Gust: 20 (6:10 PM) RH% Min/Max: 20-66 Feel Min/Max: 39 to 74 | 04 High: 76.409584 Low: 34.849403 Precip: M Avg Wind: WNW @ 4.1 Gust: 19 (10:40 PM) RH% Min/Max: 18-74 Feel Min/Max: 35 to 76 | 05 High: 77.70921 Low: 42.60921 Precip: M Avg Wind: WSW @ 3.3 Gust: 16 (7:10 PM) RH% Min/Max: 16-64 Feel Min/Max: 43 to 78 | 06 High: 83.19919 Low: 45.429787 Precip: M Avg Wind: S @ 3.8 Gust: 18 (1:20 AM) RH% Min/Max: 13-62 Feel Min/Max: 45 to 81 | 07 High: 87.69919 Low: 44.920406 Precip: M Avg Wind: SSW @ 4.5 Gust: 26 (5:30 PM) RH% Min/Max: 16-75 Feel Min/Max: 45 to 84 |
| 08 High: 90.10042 Low: 46.599777 Precip: M Avg Wind: NW @ 4.5 Gust: 25 (7:00 PM) RH% Min/Max: 18-77 Feel Min/Max: 47 to 86 | 09 High: 92.60058 Low: 45.3002 Precip: M Avg Wind: S @ 2.9 Gust: 16 (3:40 PM) RH% Min/Max: 13-71 Feel Min/Max: 45 to 88 | 10 High: 91.39999 Low: 48.050575 Precip: M Avg Wind: SW @ 3.6 Gust: 24 (3:10 PM) RH% Min/Max: 16-73 Feel Min/Max: 48 to 87 | 11 High: 93.99919 Low: 52.129414 Precip: M Avg Wind: NW @ 8.3 Gust: 37 (4:40 PM) RH% Min/Max: 17-70 Feel Min/Max: 52 to 90 | 12 High: 90.60079 Low: 47.699615 Precip: M Avg Wind: W @ 6.4 Gust: 36 (6:50 PM) RH% Min/Max: 18-87 Feel Min/Max: 48 to 87 | 13 High: 91.2002 Low: 49.710224 Precip: M Avg Wind: SSE @ 5.6 Gust: 24 (3:50 PM) RH% Min/Max: 14-77 Feel Min/Max: 50 to 87 | 14 High: 92.40079 Low: 49.479786 Precip: M Avg Wind: SSE @ 5.1 Gust: 24 (4:30 PM) RH% Min/Max: 11-68 Feel Min/Max: 49 to 88 |
| 15 High: 94.60042 Low: 48.43938 Precip: M Avg Wind: SSE @ 5.6 Gust: 24 (4:10 PM) RH% Min/Max: 8-65 Feel Min/Max: 48 to 89 | 16 High: 70.089806 Low: 60.44002 Precip: M Gust: 12 (12:00 AM) RH% Min/Max: 28-40 Feel Min/Max: 60 to 70 | 17 Precip: M | 18 | 19 | 20 | 21 |
| 22 | 23 | 24 | 25 | 26 | 27 | 28 |
| 29 | 30 | 01 | 02 | 03 | 04 | 05 |
The data presented here provided by IEM API webservice: daily.json. A simple CSV option exists as well.
Daily High/Low Plot
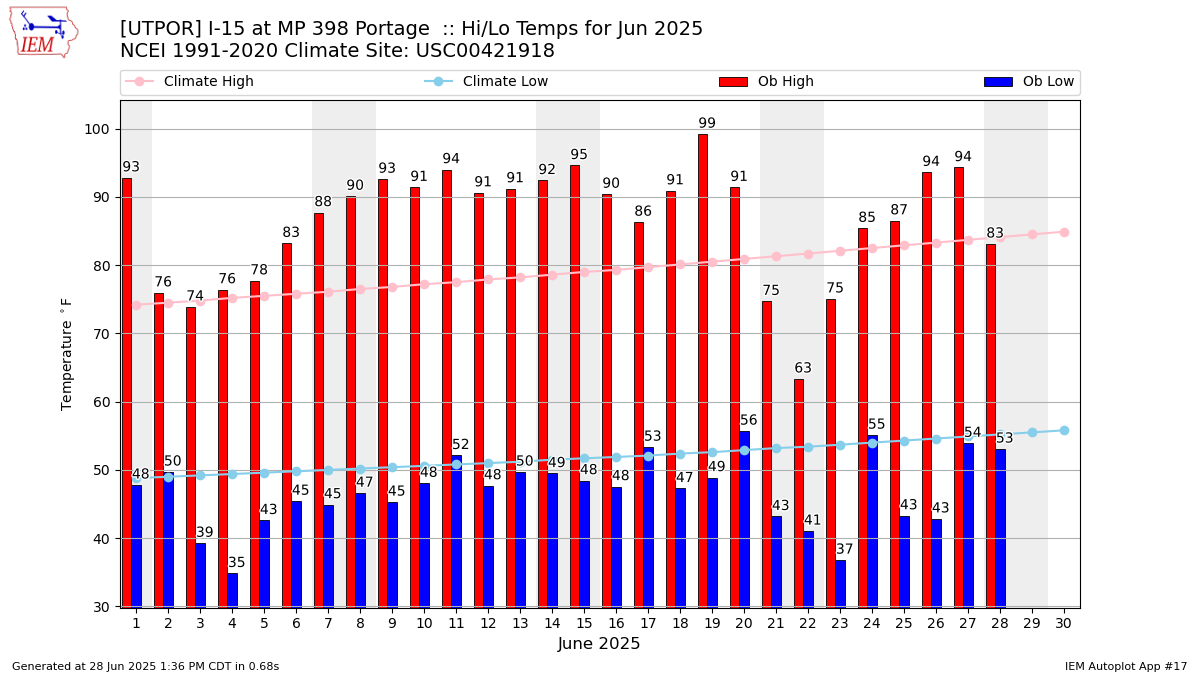
Description: This chart of the monthly temperature data. The bars are the observations and the dots are climatology.
Daily Rainfall
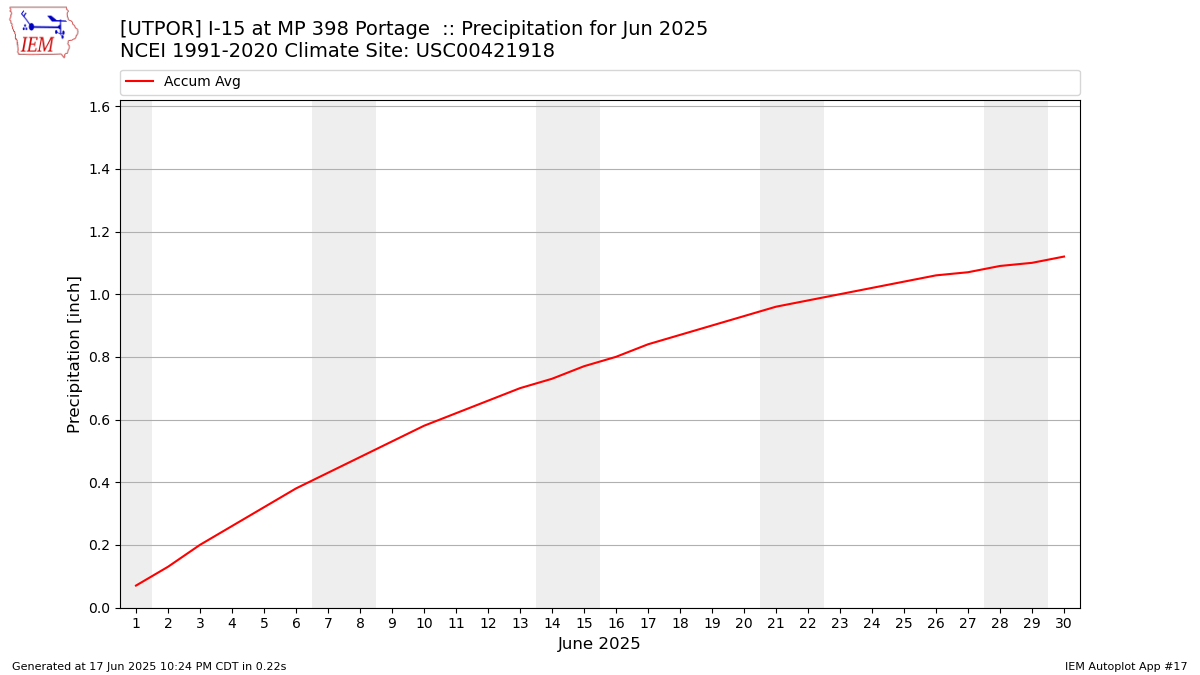
Description: This chart is of daily precipitation for the month. The red line would be an average month while the blue line and bars are observations.
Daily Average Wind Speeds
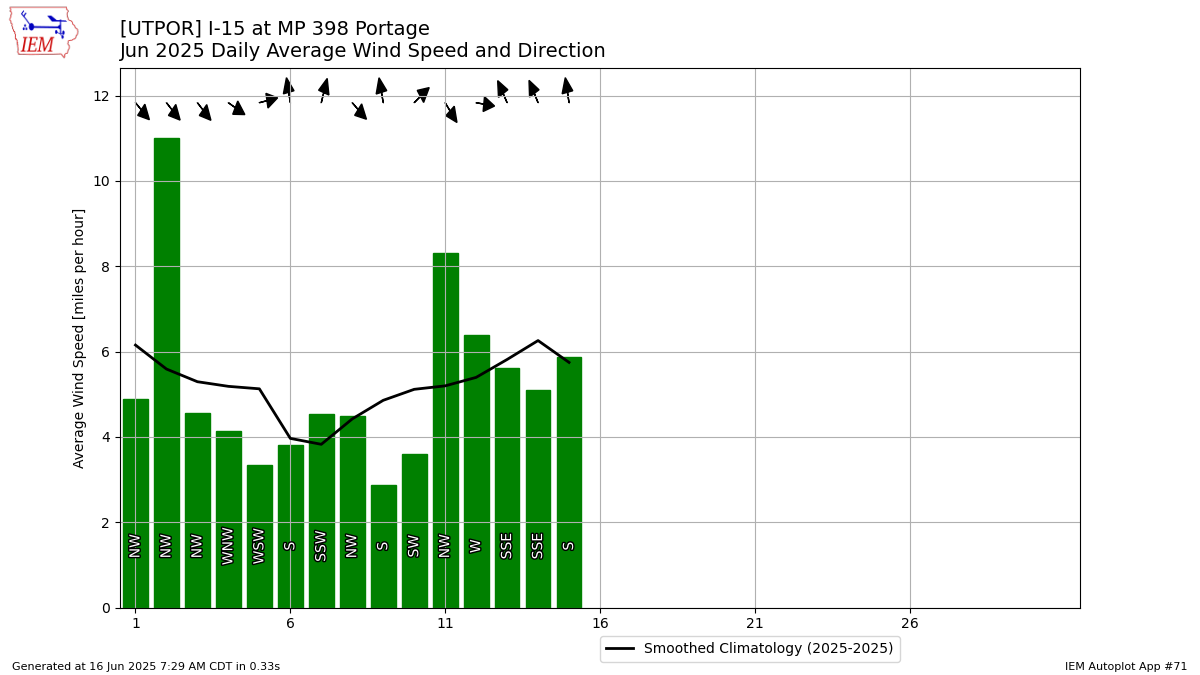
Description: This chart is of the daily average wind speeds.
The data presented here provided by IEM API webservice: daily.json. A simple CSV option exists as well.