| May 2025 | Jun 2025 | Jul 2025 | ||||
|---|---|---|---|---|---|---|
| Sunday | Monday | Tuesday | Wednesday | Thursday | Friday | Saturday |
| 01 High: 93.7994 Low: 61.300415 Precip: M Avg Wind: S @ 5.4 Gust: 22 (9:00 PM) RH% Min/Max: 9-44 Feel Min/Max: 61 to 88 | 02 High: 79.12041 Low: 64.180374 Precip: M Avg Wind: NNW @ 6.3 Gust: 21 (10:30 AM) RH% Min/Max: 11-43 Feel Min/Max: 64 to 79 | 03 High: 73.5404 Low: 48.160385 Precip: M Avg Wind: SW @ 4.6 Gust: 21 (4:30 PM) RH% Min/Max: 15-53 Feel Min/Max: 45 to 74 | 04 High: 75.90921 Low: 48.419605 Precip: M Avg Wind: SSW @ 4.3 Gust: 17 (11:50 AM) RH% Min/Max: 12-53 Feel Min/Max: 46 to 76 | 05 High: 78.31039 Low: 50.880215 Precip: M Avg Wind: S @ 4.9 Gust: 16 (5:40 PM) RH% Min/Max: 11-44 Feel Min/Max: 51 to 78 | 06 High: 81.3002 Low: 54.3002 Precip: M Avg Wind: S @ 5.8 Gust: 16 (2:30 PM) RH% Min/Max: 13-44 Feel Min/Max: 54 to 80 | 07 High: 85.6994 Low: 55.079628 Precip: M Avg Wind: S @ 5.0 Gust: 17 (3:40 PM) RH% Min/Max: 14-43 Feel Min/Max: 55 to 82 |
| 08 High: 89.49919 Low: 59.149403 Precip: M Avg Wind: SSW @ 4.7 Gust: 15 (3:30 PM) RH% Min/Max: 13-46 Feel Min/Max: 59 to 86 | 09 High: 91.999405 Low: 61.570404 Precip: M Avg Wind: SSW @ 4.2 Gust: 16 (3:10 PM) RH% Min/Max: 7-50 Feel Min/Max: 62 to 87 | 10 High: 92.19919 Low: 61.759426 Precip: M Avg Wind: S @ 5.2 Gust: 16 (5:20 AM) RH% Min/Max: 12-41 Feel Min/Max: 62 to 88 | 11 High: 95.7002 Low: 64.04002 Precip: M Avg Wind: S @ 7.7 Gust: 26 (7:10 PM) RH% Min/Max: 11-45 Feel Min/Max: 64 to 91 | 12 High: 92.699615 Low: 63.78981 Precip: M Avg Wind: SW @ 4.1 Gust: 16 (9:20 PM) RH% Min/Max: 14-58 Feel Min/Max: 64 to 88 | 13 High: 93.59962 Low: 63.530586 Precip: M Avg Wind: S @ 4.9 Gust: 23 (1:30 PM) RH% Min/Max: 11-51 Feel Min/Max: 64 to 89 | 14 High: 93.19999 Low: 63.6098 Precip: M Avg Wind: S @ 5.5 Gust: 19 (1:00 PM) RH% Min/Max: 9-37 Feel Min/Max: 64 to 89 |
| 15 High: 94.09999 Low: 63.559425 Precip: M Avg Wind: S @ 5.5 Gust: 18 (12:30 PM) RH% Min/Max: 6-37 Feel Min/Max: 64 to 88 | 16 High: 89.59999 Low: 62.34082 Precip: M Avg Wind: S @ 5.0 Gust: 16 (2:40 PM) RH% Min/Max: 7-34 Feel Min/Max: 62 to 86 | 17 High: 86.199776 Low: 60.420193 Precip: M Avg Wind: WSW @ 4.5 Gust: 20 (1:20 PM) RH% Min/Max: 12-45 Feel Min/Max: 60 to 83 | 18 High: 92.40079 Low: 59.950417 Precip: M Avg Wind: S @ 4.7 Gust: 14 (6:30 AM) RH% Min/Max: 9-40 Feel Min/Max: 60 to 87 | 19 High: 101.60058 Low: 65.269394 Precip: M Avg Wind: S @ 7.0 Gust: 26 (7:40 PM) RH% Min/Max: 5-36 Feel Min/Max: 65 to 94 | 20 High: 94.299774 Low: 59.68938 Precip: M Avg Wind: SSW @ 9.0 Gust: 35 (9:40 PM) RH% Min/Max: 6-38 Feel Min/Max: 60 to 88 | 21 High: 75.09018 Low: 52.680214 Precip: M Avg Wind: NW @ 8.2 Gust: 37 (7:40 PM) RH% Min/Max: 17-51 Feel Min/Max: 53 to 75 |
| 22 High: 64.59082 Low: 44.130215 Precip: M Avg Wind: WNW @ 4.8 Gust: 24 (2:30 PM) RH% Min/Max: 19-86 Feel Min/Max: 43 to 65 | 23 High: 74.1308 Low: 47.24061 Precip: M Avg Wind: WNW @ 3.8 Gust: 15 (5:30 PM) RH% Min/Max: 13-48 Feel Min/Max: 45 to 74 | 24 High: 82.999405 Low: 61.08981 Precip: M Avg Wind: SSW @ 4.6 Gust: 17 (2:20 PM) RH% Min/Max: 13-37 Feel Min/Max: 61 to 80 | 25 High: 85.8002 Low: 57.570778 Precip: M Avg Wind: S @ 4.6 Gust: 14 (12:40 PM) RH% Min/Max: 8-40 Feel Min/Max: 58 to 82 | 26 High: 93.9002 Low: 57.81918 Precip: M Avg Wind: SSE @ 5.7 Gust: 19 (2:10 PM) RH% Min/Max: 7-34 Feel Min/Max: 58 to 88 | 27 High: 93.70042 Low: 61.509212 Precip: M Avg Wind: S @ 6.0 Gust: 21 (11:40 PM) RH% Min/Max: 7-34 Feel Min/Max: 62 to 88 | 28 High: 93.09919 Low: 63.06081 Precip: M Avg Wind: S @ 4.7 Gust: 14 (9:40 AM) RH% Min/Max: 10-34 Feel Min/Max: 63 to 88 |
| 29 High: 88.10058 Low: 63.640396 Precip: M Gust: 13 (8:10 AM) RH% Min/Max: 19-46 Feel Min/Max: 64 to 85 | 30 Precip: M | 01 | 02 | 03 | 04 | 05 |
The data presented here provided by IEM API webservice: daily.json. A simple CSV option exists as well.
Daily High/Low Plot
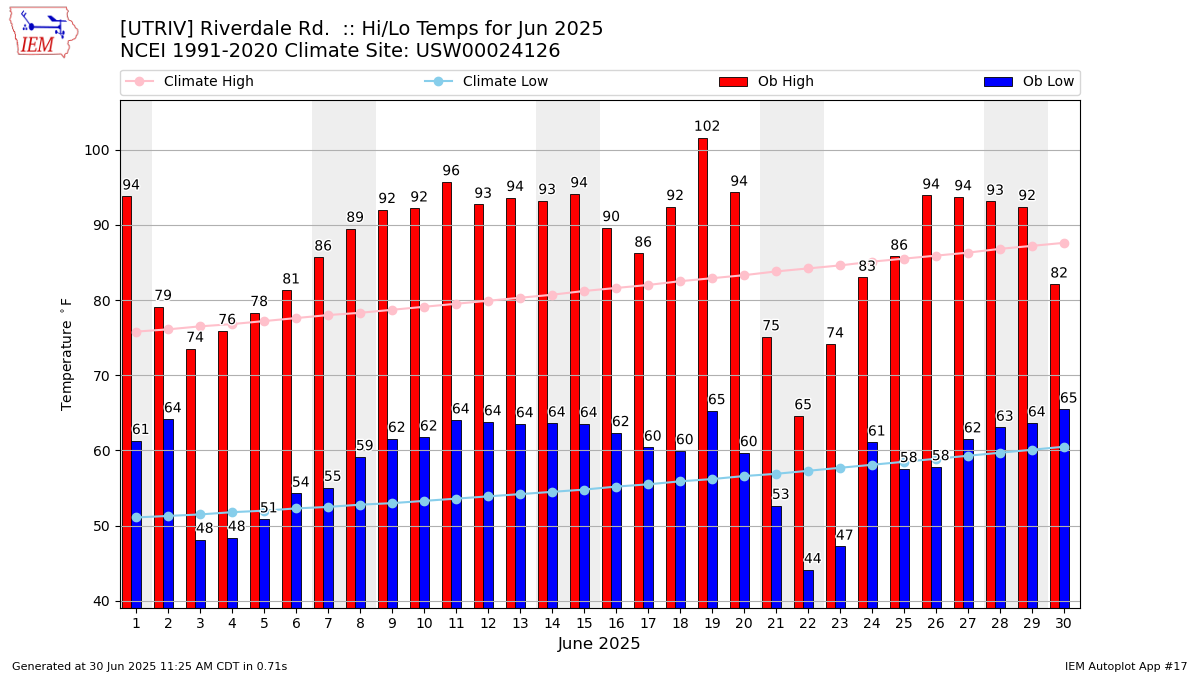
Description: This chart of the monthly temperature data. The bars are the observations and the dots are climatology.
Daily Rainfall
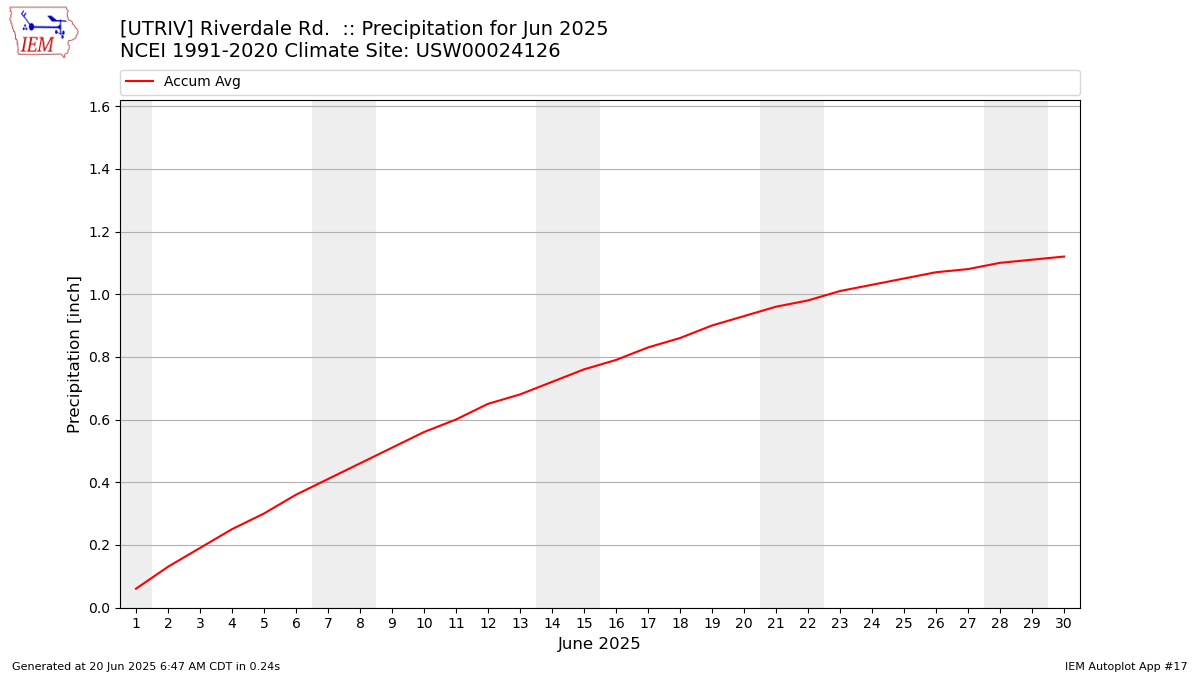
Description: This chart is of daily precipitation for the month. The red line would be an average month while the blue line and bars are observations.
Daily Average Wind Speeds

Description: This chart is of the daily average wind speeds.
The data presented here provided by IEM API webservice: daily.json. A simple CSV option exists as well.