| May 2025 | Jun 2025 | Jul 2025 | ||||
|---|---|---|---|---|---|---|
| Sunday | Monday | Tuesday | Wednesday | Thursday | Friday | Saturday |
| 01 High: 80.59999 Low: 37.000416 Precip: M Avg Wind: W @ 6.6 Gust: 28 (7:40 PM) RH% Min/Max: 10-69 Feel Min/Max: 31 to 80 | 02 High: 69.920616 Low: 42.330215 Precip: M Avg Wind: NW @ 8.6 Gust: 28 (1:20 PM) RH% Min/Max: 31-74 Feel Min/Max: 40 to 70 | 03 High: 63.649403 Low: 32.160225 Precip: M Avg Wind: NW @ 10.3 Gust: 37 (7:00 PM) RH% Min/Max: 18-72 Feel Min/Max: 28 to 64 | 04 High: 67.65079 Low: 29.840021 Precip: M Avg Wind: WNW @ 6.3 Gust: 23 (3:50 PM) RH% Min/Max: 22-77 Feel Min/Max: 24 to 68 | 05 High: 67.06939 Low: 36.660225 Precip: M Avg Wind: W @ 6.9 Gust: 33 (4:30 PM) RH% Min/Max: 25-93 Feel Min/Max: 31 to 67 | 06 High: 67.190025 Low: 35.729572 Precip: M Avg Wind: WNW @ 8.6 Gust: 34 (2:00 PM) RH% Min/Max: 23-94 Feel Min/Max: 31 to 67 | 07 High: 73.38922 Low: 34.109585 Precip: M Avg Wind: NW @ 8.0 Gust: 28 (12:50 PM) RH% Min/Max: 18-93 Feel Min/Max: 29 to 73 |
| 08 High: 76.290825 Low: 38.22078 Precip: M Avg Wind: NW @ 8.5 Gust: 33 (2:30 PM) RH% Min/Max: 14-78 Feel Min/Max: 34 to 76 | 09 High: 76.62019 Low: 38.64919 Precip: M Avg Wind: SSE @ 4.6 Gust: 19 (1:30 PM) RH% Min/Max: 20-82 Feel Min/Max: 34 to 77 | 10 High: 79.680214 Low: 37.459427 Precip: M Avg Wind: WNW @ 6.9 Gust: 30 (4:50 PM) RH% Min/Max: 12-80 Feel Min/Max: 33 to 80 | 11 High: 80.99962 Low: 42.119606 Precip: M Avg Wind: WSW @ 8.0 Gust: 30 (6:10 PM) RH% Min/Max: 16-71 Feel Min/Max: 39 to 80 | 12 High: 79.469604 Low: 46.52062 Precip: M Avg Wind: W @ 7.2 Gust: 29 (2:10 PM) RH% Min/Max: 11-57 Feel Min/Max: 44 to 79 | 13 High: 79.89983 Low: 41.360012 Precip: M Avg Wind: W @ 6.5 Gust: 27 (4:10 PM) RH% Min/Max: 10-61 Feel Min/Max: 39 to 80 | 14 High: 80.90057 Low: 41.46982 Precip: M Avg Wind: WNW @ 6.7 Gust: 26 (3:10 PM) RH% Min/Max: 9-56 Feel Min/Max: 38 to 80 |
| 15 High: 82.39999 Low: 41.649776 Precip: M Avg Wind: W @ 7.9 Gust: 30 (4:50 PM) RH% Min/Max: 6-55 Feel Min/Max: 38 to 80 | 16 High: 81.60079 Low: 42.479572 Precip: M Avg Wind: W @ 7.3 Gust: 33 (2:50 PM) RH% Min/Max: 7-47 Feel Min/Max: 38 to 80 | 17 High: 58.089222 Low: 39.660812 Precip: M Gust: 8 (4:50 AM) RH% Min/Max: 35-59 Feel Min/Max: 37 to 58 | 18 Precip: M | 19 | 20 | 21 |
| 22 | 23 | 24 | 25 | 26 | 27 | 28 |
| 29 | 30 | 01 | 02 | 03 | 04 | 05 |
The data presented here provided by IEM API webservice: daily.json. A simple CSV option exists as well.
Daily High/Low Plot
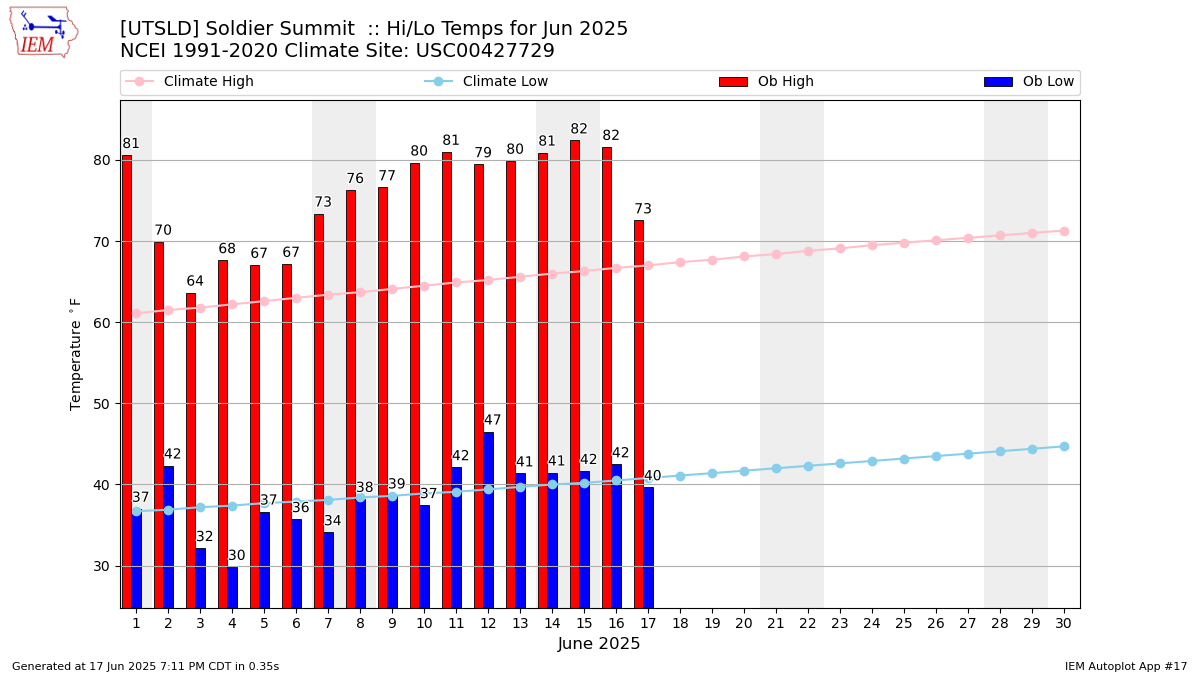
Description: This chart of the monthly temperature data. The bars are the observations and the dots are climatology.
Daily Rainfall
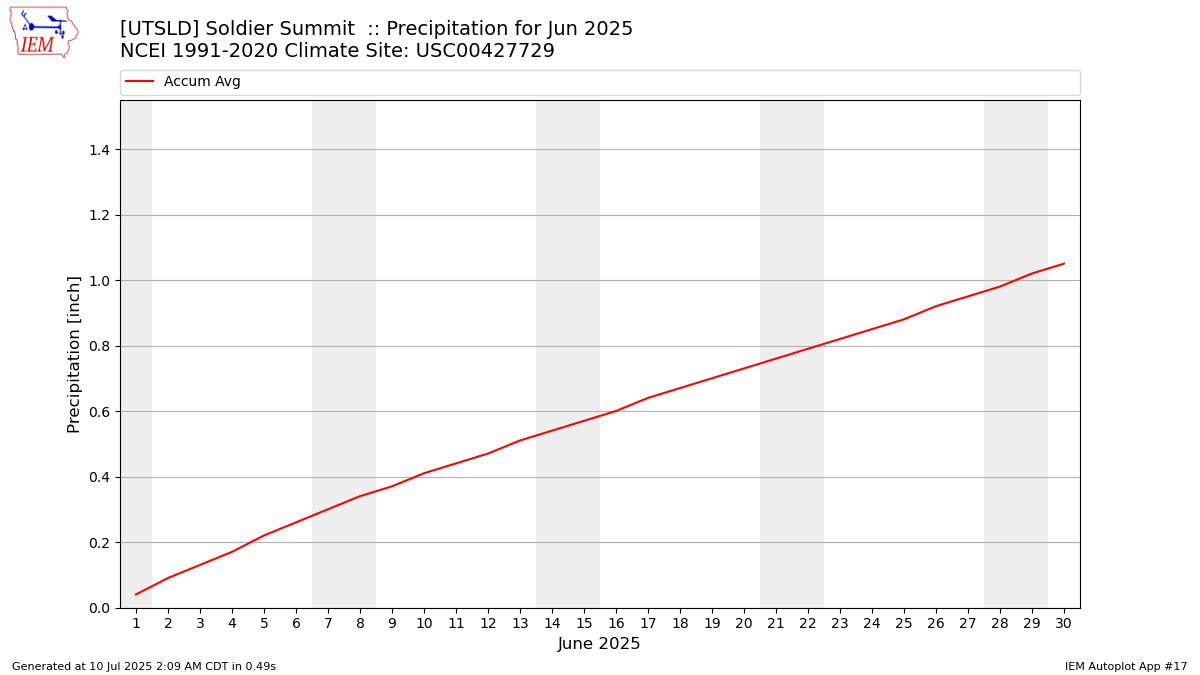
Description: This chart is of daily precipitation for the month. The red line would be an average month while the blue line and bars are observations.
Daily Average Wind Speeds
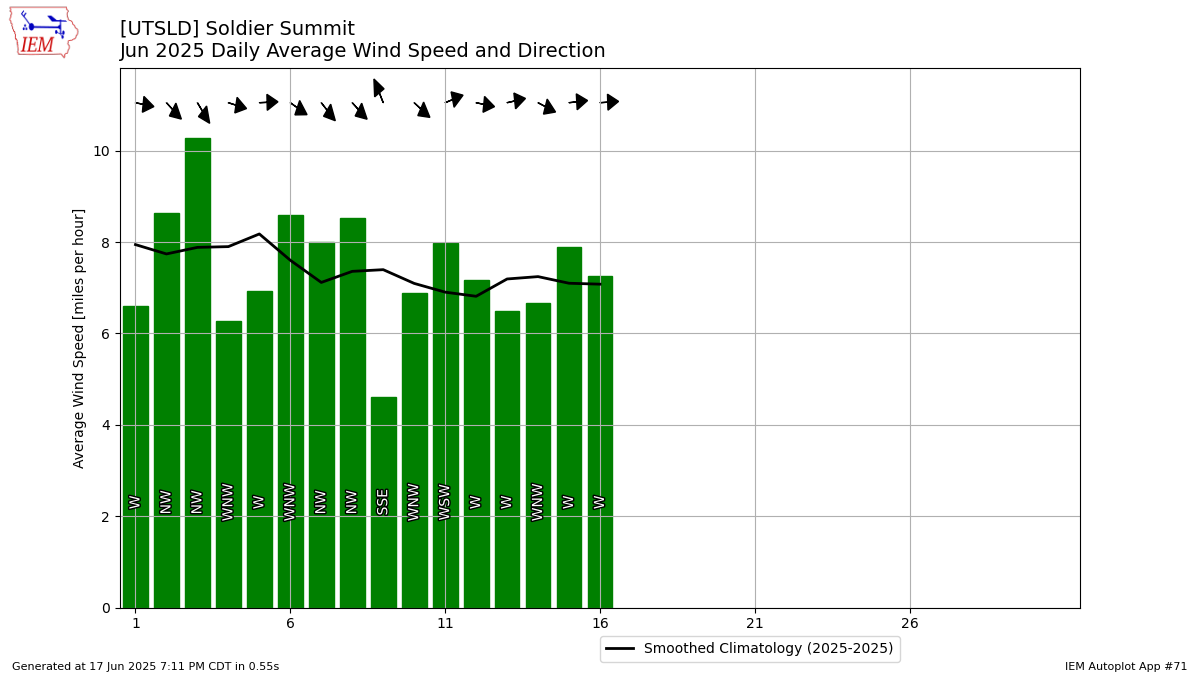
Description: This chart is of the daily average wind speeds.
The data presented here provided by IEM API webservice: daily.json. A simple CSV option exists as well.