| May 2025 | Jun 2025 | Jul 2025 | ||||
|---|---|---|---|---|---|---|
| Sunday | Monday | Tuesday | Wednesday | Thursday | Friday | Saturday |
| 01 High: 92.100204 Low: 49.769608 Precip: M Avg Wind: SSW @ 5.1 Gust: 30 (6:40 PM) RH% Min/Max: 7-57 Feel Min/Max: 50 to 87 | 02 High: 81.89962 Low: 54.23 Precip: M Avg Wind: NNE @ 4.4 Gust: 22 (4:40 PM) RH% Min/Max: 21-67 Feel Min/Max: 54 to 80 | 03 High: 75.95058 Low: 45.140022 Precip: M Avg Wind: W @ 5.6 Gust: 36 (3:50 PM) RH% Min/Max: 10-67 Feel Min/Max: 45 to 76 | 04 High: 78.169975 Low: -40.03959 Precip: M Avg Wind: SW @ 4.9 Gust: 22 (2:20 PM) RH% Min/Max: 18-60 Feel Min/Max: 43 to 78 | 05 High: 78.4598 Low: 48.63922 Precip: M Avg Wind: SSW @ 6.4 Gust: 33 (5:30 PM) RH% Min/Max: 19-70 Feel Min/Max: 48 to 78 | 06 High: 80.00063 Low: 44.639595 Precip: M Avg Wind: SW @ 4.8 Gust: 20 (1:10 PM) RH% Min/Max: 18-84 Feel Min/Max: 45 to 80 | 07 High: 84.70042 Low: 46.74919 Precip: M Avg Wind: WSW @ 4.6 Gust: 20 (4:10 PM) RH% Min/Max: 10-71 Feel Min/Max: 46 to 82 |
| 08 High: 88.59919 Low: 49.22062 Precip: M Avg Wind: W @ 5.4 Gust: 21 (6:30 PM) RH% Min/Max: 11-58 Feel Min/Max: 49 to 84 | 09 High: 89.2994 Low: 52.849403 Precip: M Avg Wind: N @ 4.2 Gust: 23 (11:00 PM) RH% Min/Max: 6-56 Feel Min/Max: 53 to 85 | 10 High: 90.49999 Low: 49.350204 Precip: M Avg Wind: SSW @ 4.6 Gust: 24 (2:30 PM) RH% Min/Max: 7-61 Feel Min/Max: 49 to 86 | 11 High: 92.800415 Low: 57.14061 Precip: M Avg Wind: SSW @ 7.7 Gust: 30 (6:00 PM) RH% Min/Max: 10-54 Feel Min/Max: 57 to 88 | 12 High: 90.39919 Low: 54.150787 Precip: M Avg Wind: SSW @ 7.1 Gust: 26 (7:30 PM) RH% Min/Max: 9-49 Feel Min/Max: 54 to 86 | 13 High: 90.60079 Low: 55.099403 Precip: M Avg Wind: SSW @ 7.3 Gust: 23 (1:50 PM) RH% Min/Max: 7-46 Feel Min/Max: 55 to 86 | 14 High: 91.999405 Low: 52.010597 Precip: M Avg Wind: SSW @ 5.2 Gust: 21 (3:00 PM) RH% Min/Max: 6-47 Feel Min/Max: 52 to 87 |
| 15 High: 93.000206 Low: 50.739807 Precip: M Gust: 17 (3:10 PM) RH% Min/Max: 5-57 Feel Min/Max: 51 to 87 | 16 Precip: M | 17 | 18 | 19 | 20 | 21 |
| 22 | 23 | 24 | 25 | 26 | 27 | 28 |
| 29 | 30 | 01 | 02 | 03 | 04 | 05 |
The data presented here provided by IEM API webservice: daily.json. A simple CSV option exists as well.
Daily High/Low Plot
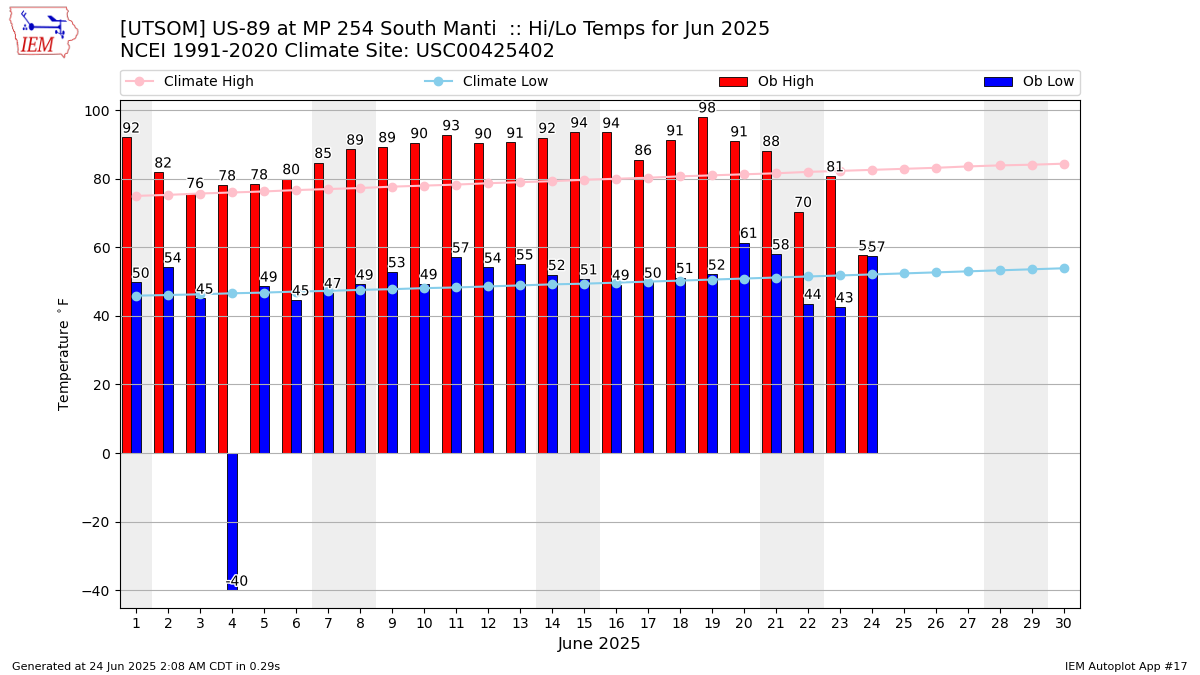
Description: This chart of the monthly temperature data. The bars are the observations and the dots are climatology.
Daily Rainfall
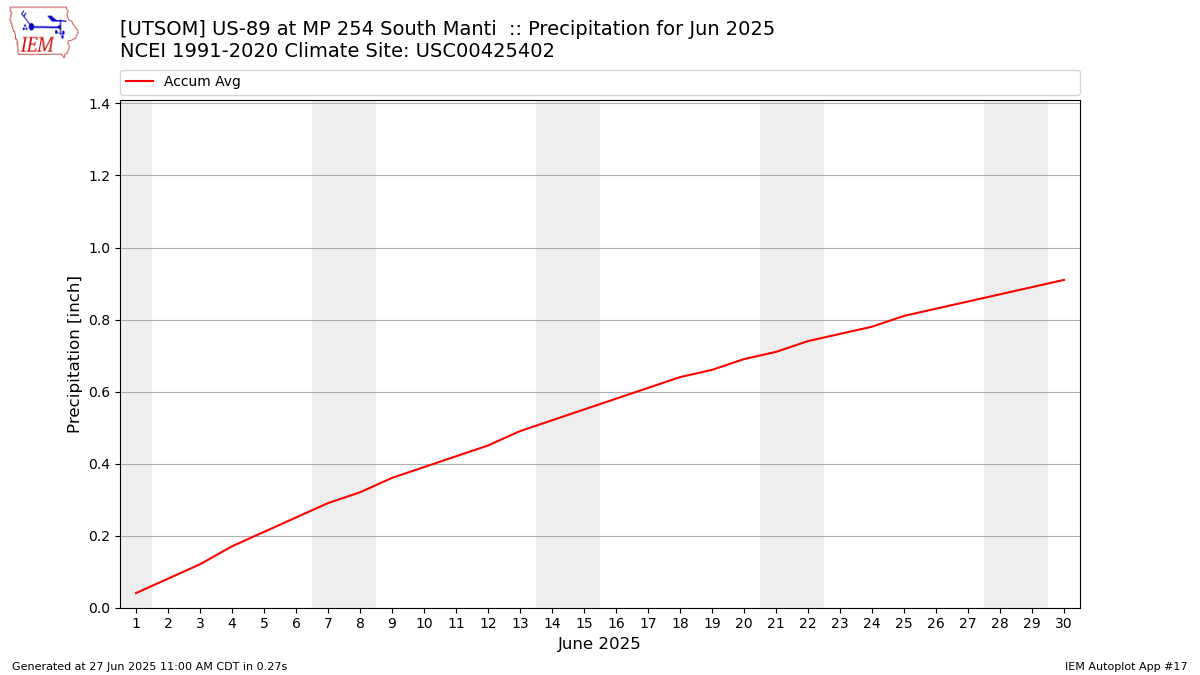
Description: This chart is of daily precipitation for the month. The red line would be an average month while the blue line and bars are observations.
Daily Average Wind Speeds
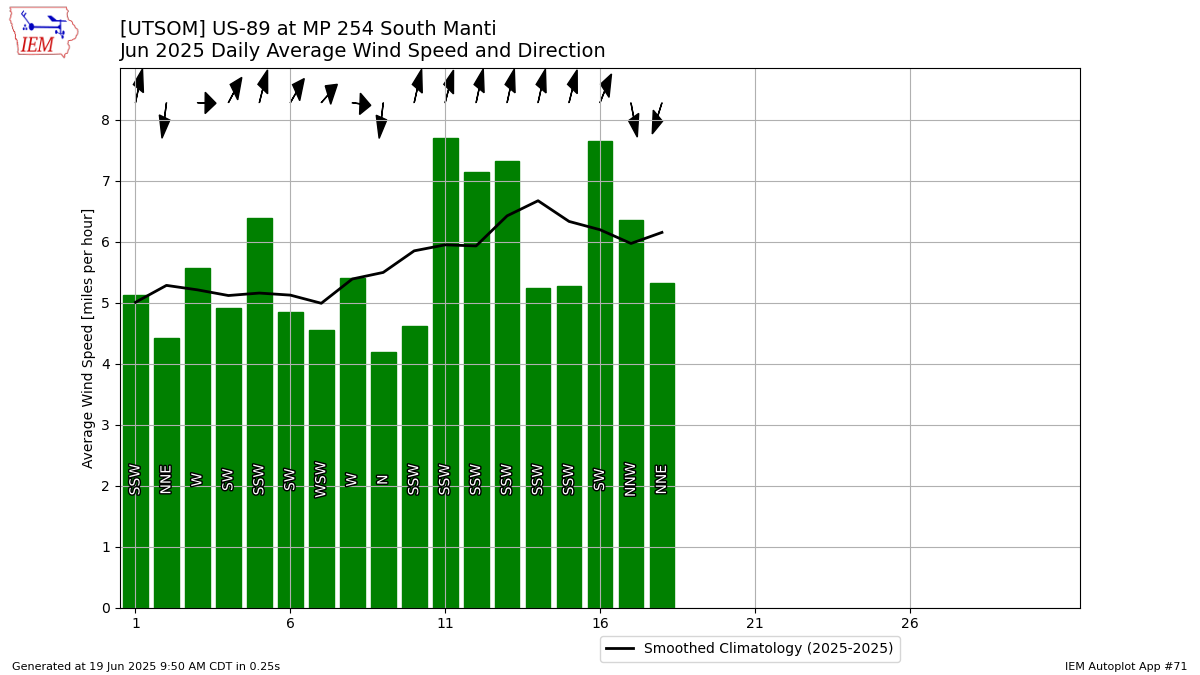
Description: This chart is of the daily average wind speeds.
The data presented here provided by IEM API webservice: daily.json. A simple CSV option exists as well.