| May 2025 | Jun 2025 | Jul 2025 | ||||
|---|---|---|---|---|---|---|
| Sunday | Monday | Tuesday | Wednesday | Thursday | Friday | Saturday |
| 01 High: 79.300415 Low: 38.780586 Precip: M Avg Wind: W @ 7.0 Gust: 27 (4:30 PM) RH% Min/Max: 13-66 Feel Min/Max: 39 to 79 | 02 High: 69.389595 Low: 47.87062 Precip: M Avg Wind: WNW @ 6.9 Gust: 27 (3:40 AM) RH% Min/Max: 34-66 Feel Min/Max: 48 to 69 | 03 High: 65.98043 Low: 38.69061 Precip: M Avg Wind: WNW @ 8.1 Gust: 38 (3:20 PM) RH% Min/Max: 19-85 Feel Min/Max: 39 to 66 | 04 High: 65.62041 Low: 32.01081 Precip: M Avg Wind: SSE @ 3.9 Gust: 25 (6:20 PM) RH% Min/Max: 29-68 Feel Min/Max: 32 to 66 | 05 High: 61.500202 Low: 37.380215 Precip: M Avg Wind: ESE @ 3.5 Gust: 24 (5:30 PM) RH% Min/Max: 42-92 Feel Min/Max: 37 to 62 | 06 High: 68.81001 Low: 37.41982 Precip: M Avg Wind: WNW @ 5.1 Gust: 26 (12:50 PM) RH% Min/Max: 29-95 Feel Min/Max: 37 to 69 | 07 High: 74.22979 Low: 36.44061 Precip: M Avg Wind: WNW @ 5.0 Gust: 28 (3:40 PM) RH% Min/Max: 17-91 Feel Min/Max: 36 to 74 |
| 08 High: 77.86939 Low: 39.66982 Precip: M Avg Wind: WNW @ 5.8 Gust: 27 (3:50 PM) RH% Min/Max: 18-63 Feel Min/Max: 40 to 78 | 09 High: 79.660385 Low: 42.09082 Precip: M Avg Wind: WNW @ 4.7 Gust: 27 (5:10 PM) RH% Min/Max: 8-70 Feel Min/Max: 42 to 80 | 10 High: 79.0808 Low: 38.21001 Precip: M Avg Wind: SW @ 4.9 Gust: 23 (10:20 PM) RH% Min/Max: 14-62 Feel Min/Max: 38 to 79 | 11 High: 81.10042 Low: 44.529785 Precip: M Avg Wind: W @ 6.5 Gust: 29 (2:10 PM) RH% Min/Max: 17-63 Feel Min/Max: 45 to 80 | 12 High: 81.10042 Low: 42.339222 Precip: M Avg Wind: W @ 6.5 Gust: 31 (1:10 PM) RH% Min/Max: 12-54 Feel Min/Max: 42 to 80 | 13 High: 81.3002 Low: 40.929787 Precip: M Avg Wind: W @ 6.2 Gust: 24 (2:50 PM) RH% Min/Max: 11-49 Feel Min/Max: 41 to 80 | 14 High: 83.89941 Low: 41.99002 Precip: M Avg Wind: WNW @ 7.1 Gust: 23 (4:10 PM) RH% Min/Max: 10-46 Feel Min/Max: 41 to 81 |
| 15 High: 76.60042 Low: 46.340607 Precip: M Gust: 13 (10:40 AM) RH% Min/Max: 13-47 Feel Min/Max: 46 to 77 | 16 Precip: M | 17 | 18 | 19 | 20 | 21 |
| 22 | 23 | 24 | 25 | 26 | 27 | 28 |
| 29 | 30 | 01 | 02 | 03 | 04 | 05 |
The data presented here provided by IEM API webservice: daily.json. A simple CSV option exists as well.
Daily High/Low Plot
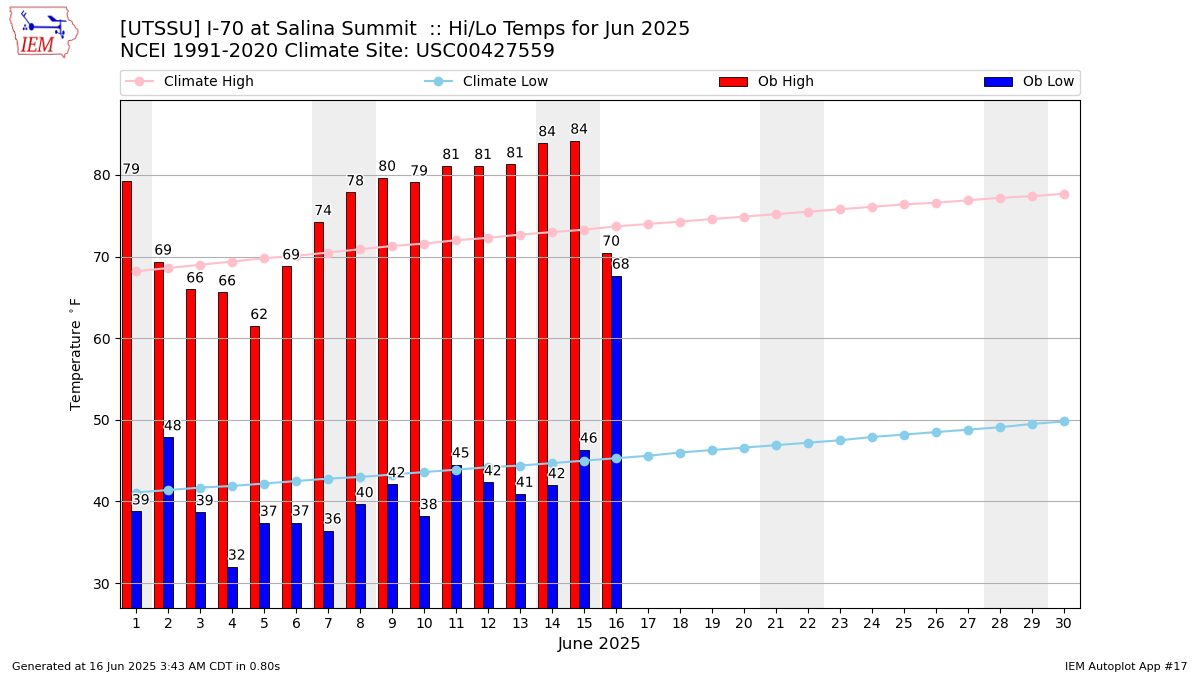
Description: This chart of the monthly temperature data. The bars are the observations and the dots are climatology.
Daily Rainfall
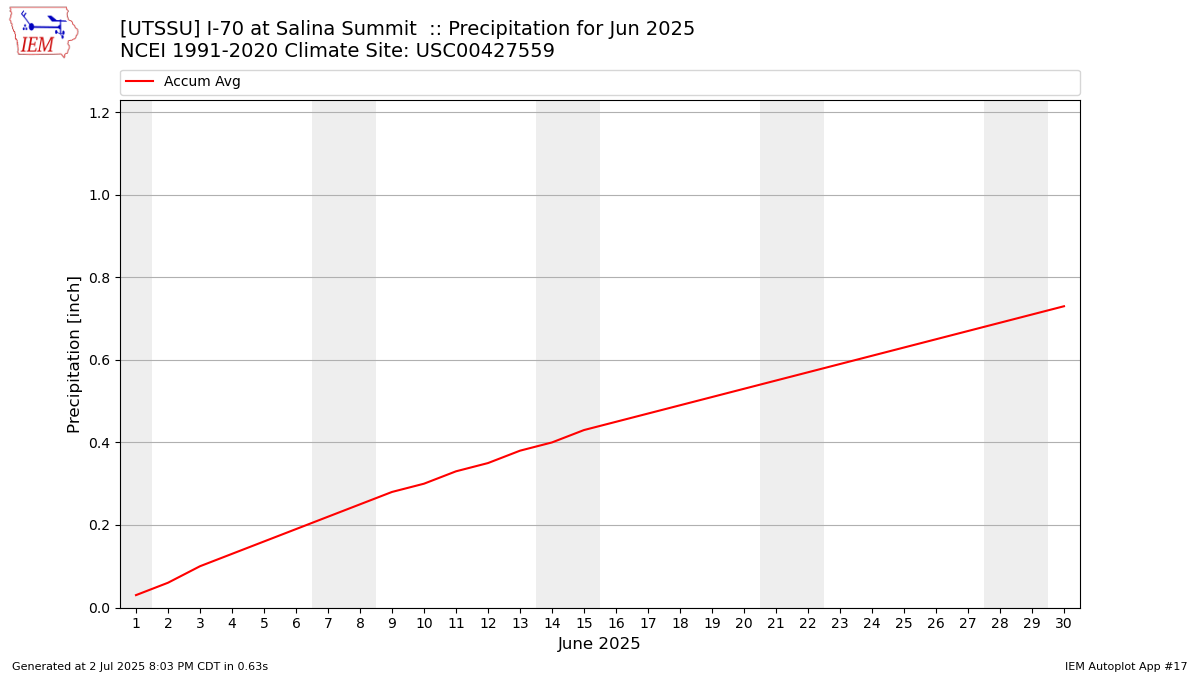
Description: This chart is of daily precipitation for the month. The red line would be an average month while the blue line and bars are observations.
Daily Average Wind Speeds
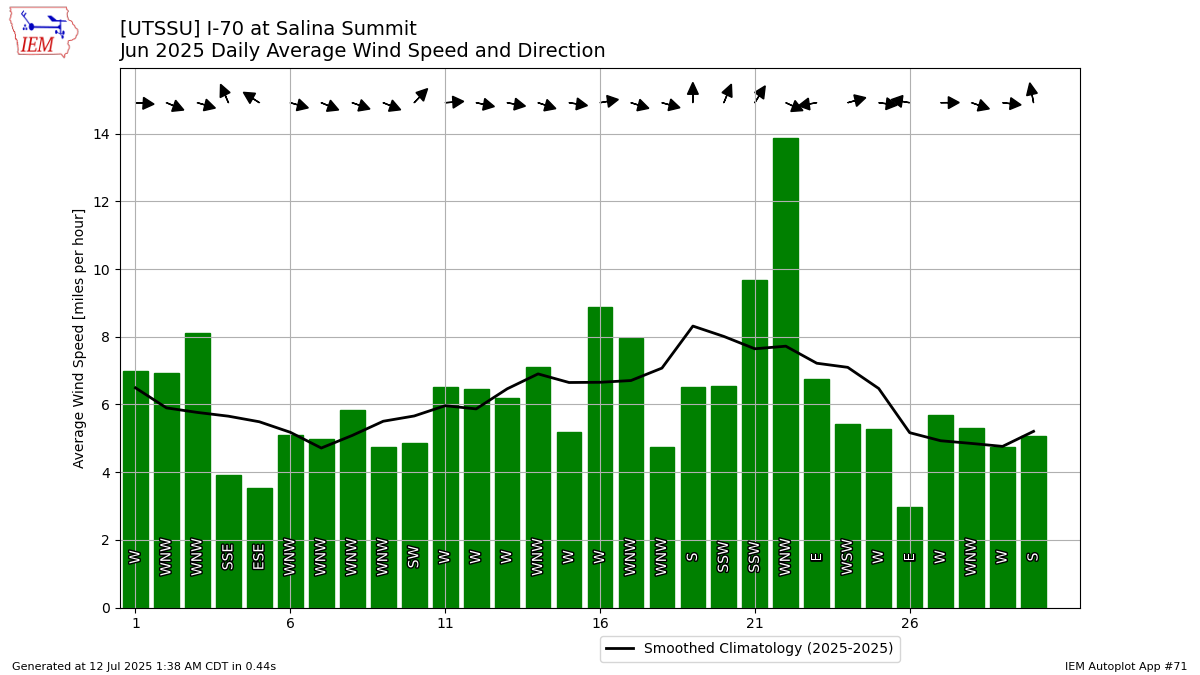
Description: This chart is of the daily average wind speeds.
The data presented here provided by IEM API webservice: daily.json. A simple CSV option exists as well.