| May 2025 | Jun 2025 | Jul 2025 | ||||
|---|---|---|---|---|---|---|
| Sunday | Monday | Tuesday | Wednesday | Thursday | Friday | Saturday |
| 01 High: 89.99962 Low: 51.650574 Precip: M Avg Wind: SSW @ 10.1 Gust: 29 (6:30 PM) RH% Min/Max: 12-42 Feel Min/Max: 52 to 86 | 02 High: 76.249405 Low: 58.38981 Precip: M Avg Wind: NNE @ 10.9 Gust: 25 (4:30 PM) RH% Min/Max: 13-51 Feel Min/Max: 58 to 76 | 03 High: 71.61081 Low: 54.78981 Precip: M Avg Wind: NNE @ 7.5 Gust: 25 (5:40 PM) RH% Min/Max: 16-37 Feel Min/Max: 55 to 72 | 04 High: 70.41918 Low: 53.49919 Precip: M Avg Wind: NNE @ 7.4 Gust: 22 (3:20 PM) RH% Min/Max: 24-45 Feel Min/Max: 53 to 70 | 05 High: 73.97062 Low: 44.86998 Precip: M Avg Wind: WNW @ 7.2 Gust: 23 (4:10 PM) RH% Min/Max: 20-49 Feel Min/Max: 40 to 74 | 06 High: 77.109795 Low: 54.84018 Precip: M Avg Wind: SSW @ 8.3 Gust: 23 (4:50 PM) RH% Min/Max: 19-61 Feel Min/Max: 55 to 77 | 07 High: 82.799614 Low: 49.519394 Precip: M Avg Wind: SSW @ 9.4 Gust: 24 (4:10 PM) RH% Min/Max: 18-45 Feel Min/Max: 44 to 80 |
| 08 High: 84.09919 Low: 52.129414 Precip: M Avg Wind: NNE @ 9.4 Gust: 24 (4:10 PM) RH% Min/Max: 18-44 Feel Min/Max: 52 to 82 | 09 High: 86.89999 Low: 50.68938 Precip: M Avg Wind: NE @ 6.9 Gust: 21 (4:00 PM) RH% Min/Max: 9-53 Feel Min/Max: 51 to 83 | 10 High: 87.69919 Low: 57.30079 Precip: M Avg Wind: S @ 7.8 Gust: 25 (1:00 PM) RH% Min/Max: 15-37 Feel Min/Max: 57 to 84 | 11 High: 94.20079 Low: 57.050575 Precip: M Avg Wind: SSW @ 14.8 Gust: 35 (12:00 PM) RH% Min/Max: 10-54 Feel Min/Max: 57 to 89 | 12 High: 91.39999 Low: 58.640022 Precip: M Avg Wind: NW @ 8.4 Gust: 25 (4:10 PM) RH% Min/Max: 10-66 Feel Min/Max: 59 to 86 | 13 High: 91.90041 Low: 56.359425 Precip: M Avg Wind: SSW @ 10.1 Gust: 32 (2:30 PM) RH% Min/Max: 7-64 Feel Min/Max: 56 to 86 | 14 High: 91.00042 Low: 64.13 Precip: M Avg Wind: SSW @ 8.4 Gust: 28 (1:40 PM) RH% Min/Max: 6-30 Feel Min/Max: 64 to 86 |
| 15 High: 92.40079 Low: 62.209427 Precip: M Gust: 28 (3:20 PM) RH% Min/Max: 5-31 Feel Min/Max: 62 to 87 | 16 Precip: M | 17 | 18 | 19 | 20 | 21 |
| 22 | 23 | 24 | 25 | 26 | 27 | 28 |
| 29 | 30 | 01 | 02 | 03 | 04 | 05 |
The data presented here provided by IEM API webservice: daily.json. A simple CSV option exists as well.
Daily High/Low Plot
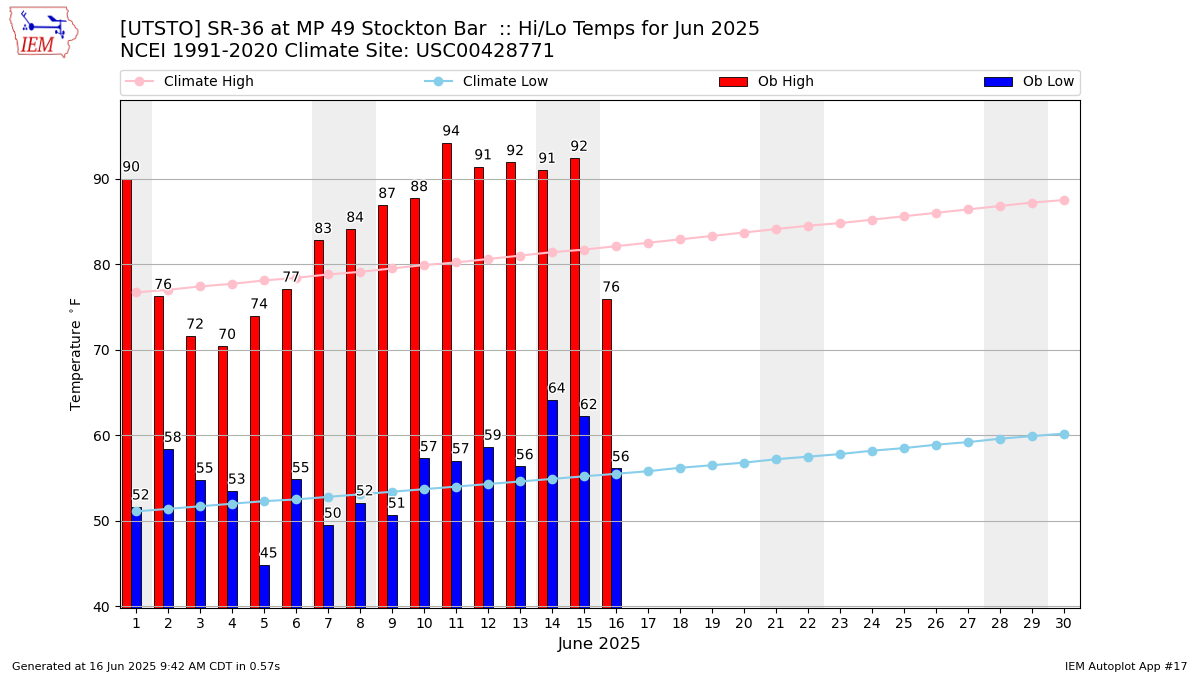
Description: This chart of the monthly temperature data. The bars are the observations and the dots are climatology.
Daily Rainfall
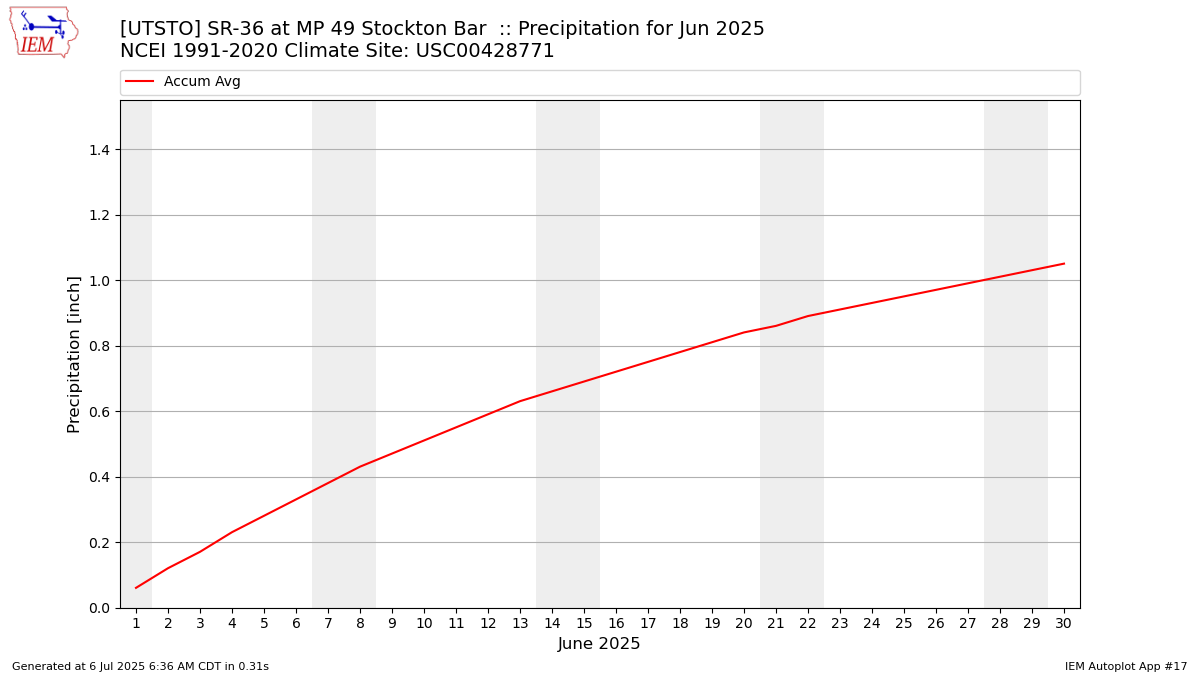
Description: This chart is of daily precipitation for the month. The red line would be an average month while the blue line and bars are observations.
Daily Average Wind Speeds
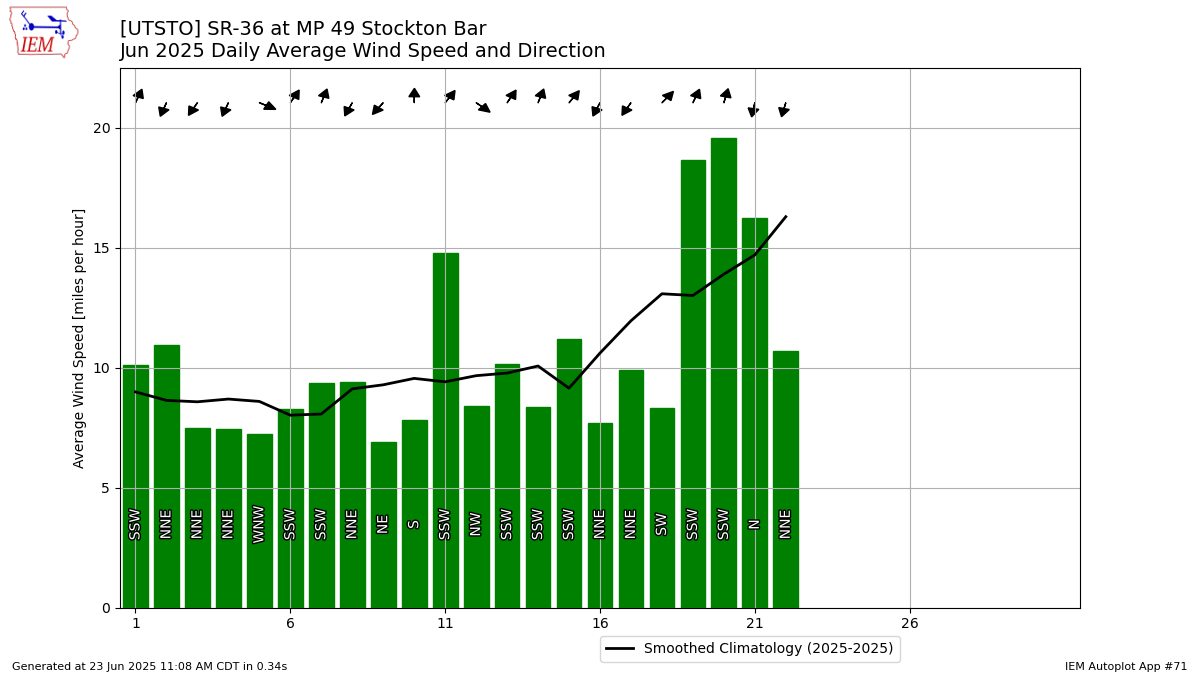
Description: This chart is of the daily average wind speeds.
The data presented here provided by IEM API webservice: daily.json. A simple CSV option exists as well.