| May 2025 | Jun 2025 | Jul 2025 | ||||
|---|---|---|---|---|---|---|
| Sunday | Monday | Tuesday | Wednesday | Thursday | Friday | Saturday |
| 01 High: 94.60042 Low: 57.27019 Precip: M Avg Wind: N @ 3.1 Gust: 27 (10:00 PM) RH% Min/Max: 8-57 Feel Min/Max: 57 to 89 | 02 High: 80.00063 Low: 58.929787 Precip: M Avg Wind: NNW @ 3.9 Gust: 18 (2:00 PM) RH% Min/Max: 10-46 Feel Min/Max: 59 to 80 | 03 High: 72.919395 Low: 48.570778 Precip: M Avg Wind: N @ 4.3 Gust: 22 (5:20 PM) RH% Min/Max: 15-54 Feel Min/Max: 48 to 73 | 04 High: 74.5502 Low: 48.54018 Precip: M Avg Wind: N @ 3.8 Gust: 21 (4:30 PM) RH% Min/Max: 18-65 Feel Min/Max: 48 to 75 | 05 High: 77.57062 Low: 48.869606 Precip: M Avg Wind: N @ 3.0 Gust: 19 (4:10 PM) RH% Min/Max: 16-55 Feel Min/Max: 49 to 78 | 06 High: 79.559586 Low: 53.560383 Precip: M Avg Wind: NE @ 3.9 Gust: 20 (3:20 PM) RH% Min/Max: 13-52 Feel Min/Max: 54 to 80 | 07 High: 84.000206 Low: 52.14919 Precip: M Avg Wind: NNE @ 3.5 Gust: 18 (5:30 PM) RH% Min/Max: 14-62 Feel Min/Max: 52 to 81 |
| 08 High: 88.10058 Low: 55.32979 Precip: M Avg Wind: NNW @ 3.0 Gust: 16 (3:40 PM) RH% Min/Max: 11-63 Feel Min/Max: 55 to 84 | 09 High: 91.2002 Low: 66.050575 Precip: M Avg Wind: NNW @ 3.5 Gust: 14 (6:10 PM) RH% Min/Max: 13-47 Feel Min/Max: 66 to 87 | 10 High: 91.70058 Low: 57.81918 Precip: M Avg Wind: NNE @ 2.9 Gust: 16 (1:50 PM) RH% Min/Max: 14-53 Feel Min/Max: 58 to 87 | 11 High: 97.199615 Low: 62.009583 Precip: M Avg Wind: S @ 4.1 Gust: 25 (1:20 PM) RH% Min/Max: 10-57 Feel Min/Max: 62 to 91 | 12 High: 92.29999 Low: 66.050575 Precip: M Avg Wind: NE @ 4.1 Gust: 23 (12:40 AM) RH% Min/Max: 13-49 Feel Min/Max: 66 to 88 | 13 High: 95.50042 Low: 61.7792 Precip: M Avg Wind: SE @ 4.5 Gust: 25 (7:10 PM) RH% Min/Max: 6-61 Feel Min/Max: 62 to 89 | 14 High: 92.699615 Low: 62.580215 Precip: M Gust: 20 (12:20 PM) RH% Min/Max: 7-42 Feel Min/Max: 63 to 87 |
| 15 Precip: M | 16 | 17 | 18 | 19 | 20 | 21 |
| 22 | 23 | 24 | 25 | 26 | 27 | 28 |
| 29 | 30 | 01 | 02 | 03 | 04 | 05 |
The data presented here provided by IEM API webservice: daily.json. A simple CSV option exists as well.
Daily High/Low Plot
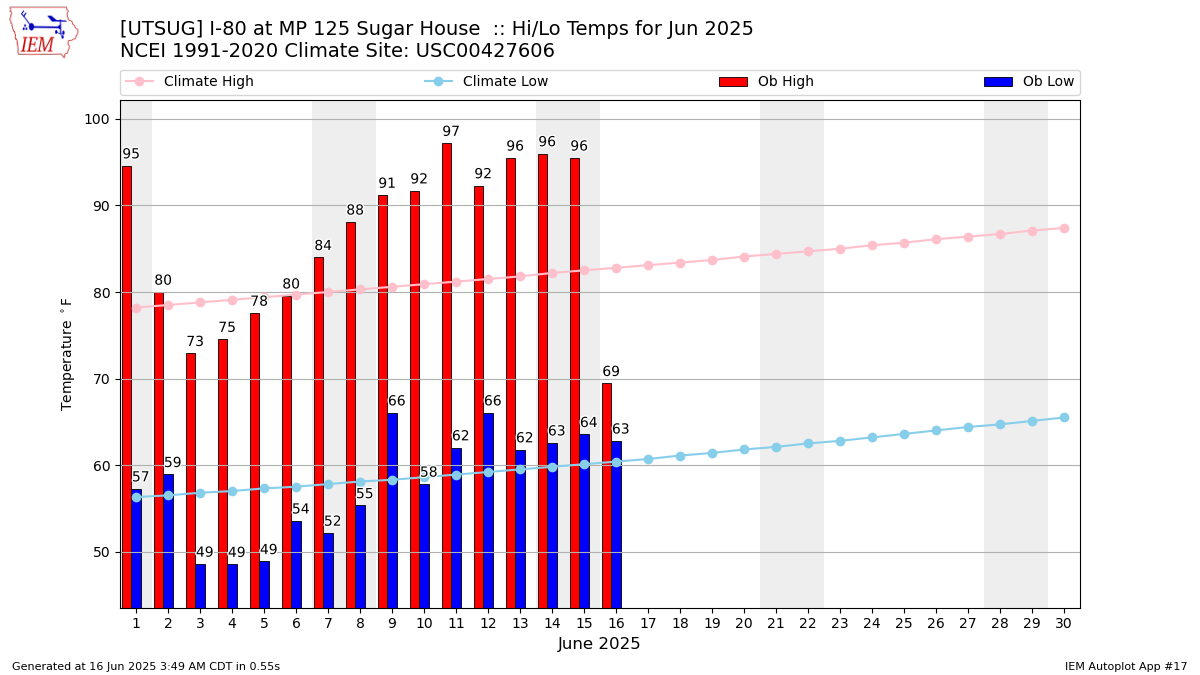
Description: This chart of the monthly temperature data. The bars are the observations and the dots are climatology.
Daily Rainfall
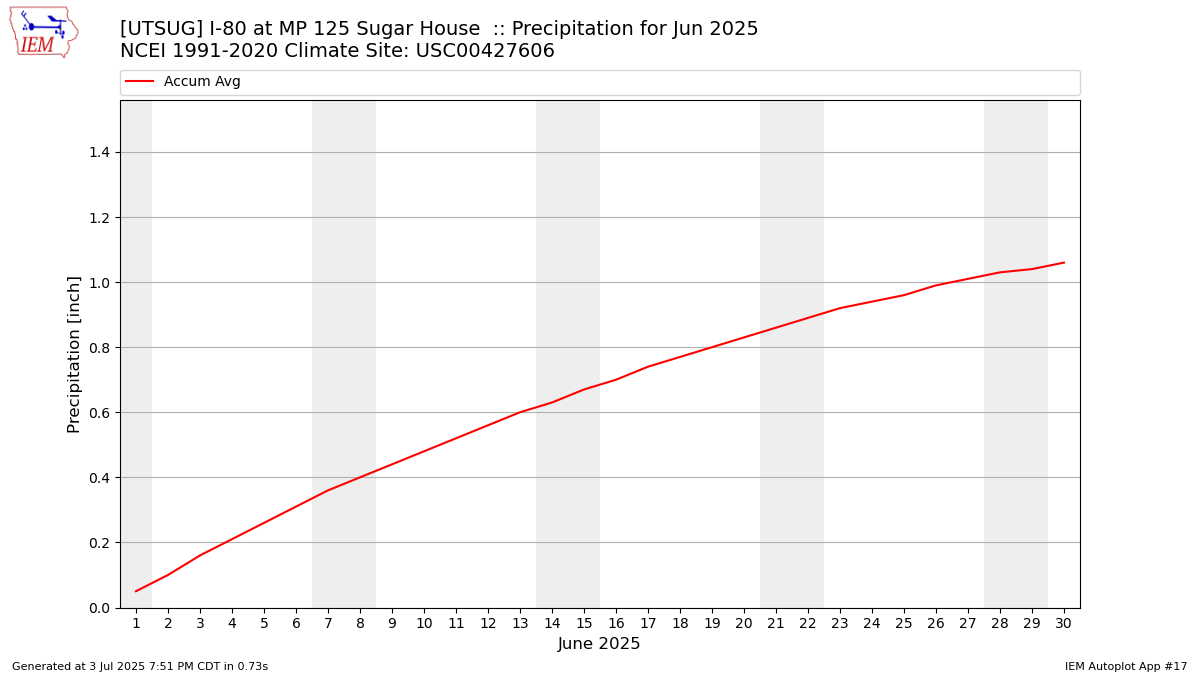
Description: This chart is of daily precipitation for the month. The red line would be an average month while the blue line and bars are observations.
Daily Average Wind Speeds
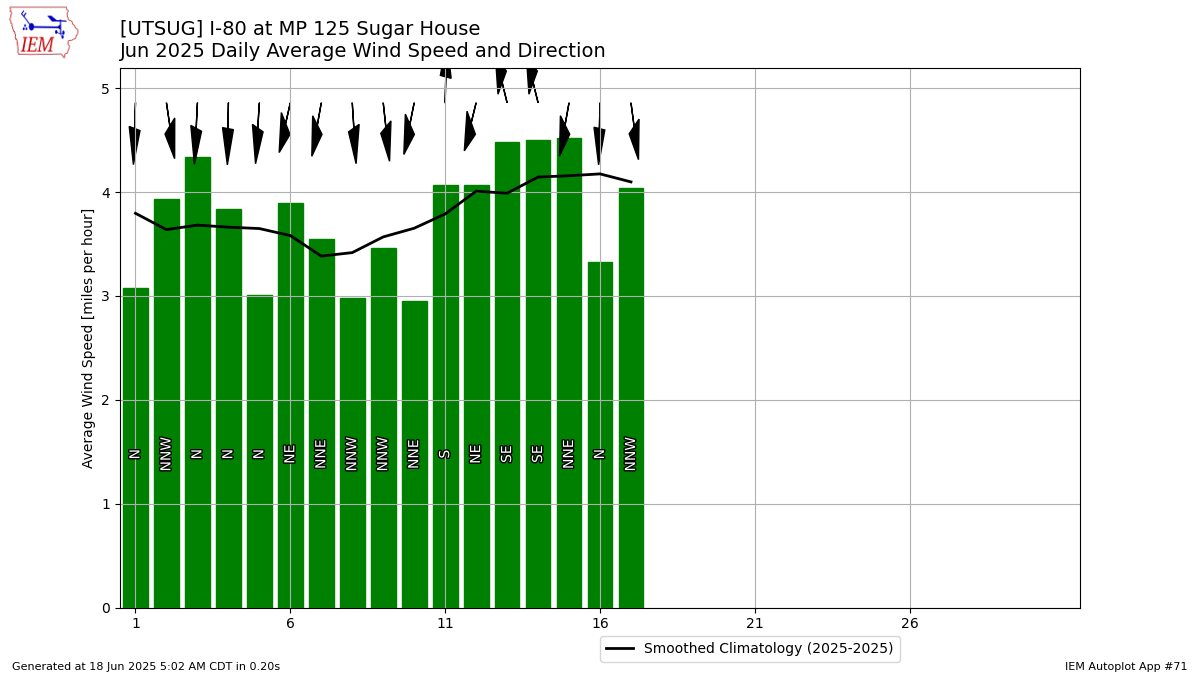
Description: This chart is of the daily average wind speeds.
The data presented here provided by IEM API webservice: daily.json. A simple CSV option exists as well.