| May 2025 | Jun 2025 | Jul 2025 | ||||
|---|---|---|---|---|---|---|
| Sunday | Monday | Tuesday | Wednesday | Thursday | Friday | Saturday |
| 01 High: 91.2002 Low: 62.27957 Precip: M Avg Wind: S @ 6.9 Gust: 36 (8:10 PM) RH% Min/Max: 10-27 Feel Min/Max: 62 to 87 | 02 High: 82.59978 Low: 63.769978 Precip: M Avg Wind: N @ 12.1 Gust: 34 (3:50 AM) RH% Min/Max: 8-30 Feel Min/Max: 64 to 80 | 03 High: 73.6808 Low: 57.2792 Precip: M Avg Wind: NNE @ 8.3 Gust: 24 (12:00 AM) RH% Min/Max: 17-25 Feel Min/Max: 57 to 74 | 04 High: 73.569176 Low: 55.63938 Precip: M Avg Wind: NNE @ 6.6 Gust: 23 (1:20 AM) RH% Min/Max: 15-29 Feel Min/Max: 56 to 74 | 05 High: 77.12062 Low: 55.29018 Precip: M Avg Wind: NNE @ 6.1 Gust: 26 (12:40 AM) RH% Min/Max: 15-30 Feel Min/Max: 55 to 77 | 06 High: 81.10042 Low: 59.739807 Precip: M Avg Wind: ENE @ 5.6 Gust: 22 (12:30 AM) RH% Min/Max: 15-27 Feel Min/Max: 60 to 80 | 07 High: 86.199776 Low: 64.909424 Precip: M Avg Wind: NE @ 6.5 Gust: 24 (2:10 AM) RH% Min/Max: 14-28 Feel Min/Max: 65 to 83 |
| 08 High: 90.39919 Low: 66.88938 Precip: M Avg Wind: N @ 7.8 Gust: 28 (2:20 PM) RH% Min/Max: 16-36 Feel Min/Max: 67 to 86 | 09 High: 90.89962 Low: 64.65921 Precip: M Avg Wind: SSE @ 6.1 Gust: 34 (10:10 PM) RH% Min/Max: 13-38 Feel Min/Max: 65 to 87 | 10 High: 91.799614 Low: 69.110596 Precip: M Avg Wind: NE @ 5.9 Gust: 24 (4:10 PM) RH% Min/Max: 15-33 Feel Min/Max: 69 to 88 | 11 High: 93.9002 Low: 63.730427 Precip: M Avg Wind: N @ 6.4 Gust: 28 (6:10 PM) RH% Min/Max: 9-43 Feel Min/Max: 64 to 90 | 12 High: 88.69999 Low: 71.33 Precip: M Avg Wind: N @ 7.5 Gust: 26 (10:30 PM) RH% Min/Max: 19-41 Feel Min/Max: 71 to 85 | 13 High: 91.500786 Low: 63.359585 Precip: M Avg Wind: NNE @ 6.7 Gust: 36 (11:20 PM) RH% Min/Max: 8-51 Feel Min/Max: 63 to 87 | 14 High: 90.1994 Low: 65.46918 Precip: M Avg Wind: N @ 6.7 Gust: 37 (12:10 AM) RH% Min/Max: 8-19 Feel Min/Max: 65 to 85 |
| 15 High: 92.29999 Low: 62.31918 Precip: M Avg Wind: NNE @ 6.5 Gust: 26 (12:40 AM) RH% Min/Max: 8-31 Feel Min/Max: 62 to 87 | 16 High: 88.500206 Low: 70.17078 Precip: M Avg Wind: NNW @ 7.3 Gust: 24 (2:20 PM) RH% Min/Max: 8-18 Feel Min/Max: 70 to 84 | 17 High: 85.6994 Low: 65.60058 Precip: M Avg Wind: ENE @ 7.1 Gust: 37 (1:40 AM) RH% Min/Max: 11-27 Feel Min/Max: 66 to 82 | 18 High: 78.85042 Low: 68.86939 Precip: M Gust: 23 (1:20 AM) RH% Min/Max: 16-29 Feel Min/Max: 69 to 79 | 19 Precip: M | 20 | 21 |
| 22 | 23 | 24 | 25 | 26 | 27 | 28 |
| 29 | 30 | 01 | 02 | 03 | 04 | 05 |
The data presented here provided by IEM API webservice: daily.json. A simple CSV option exists as well.
Daily High/Low Plot
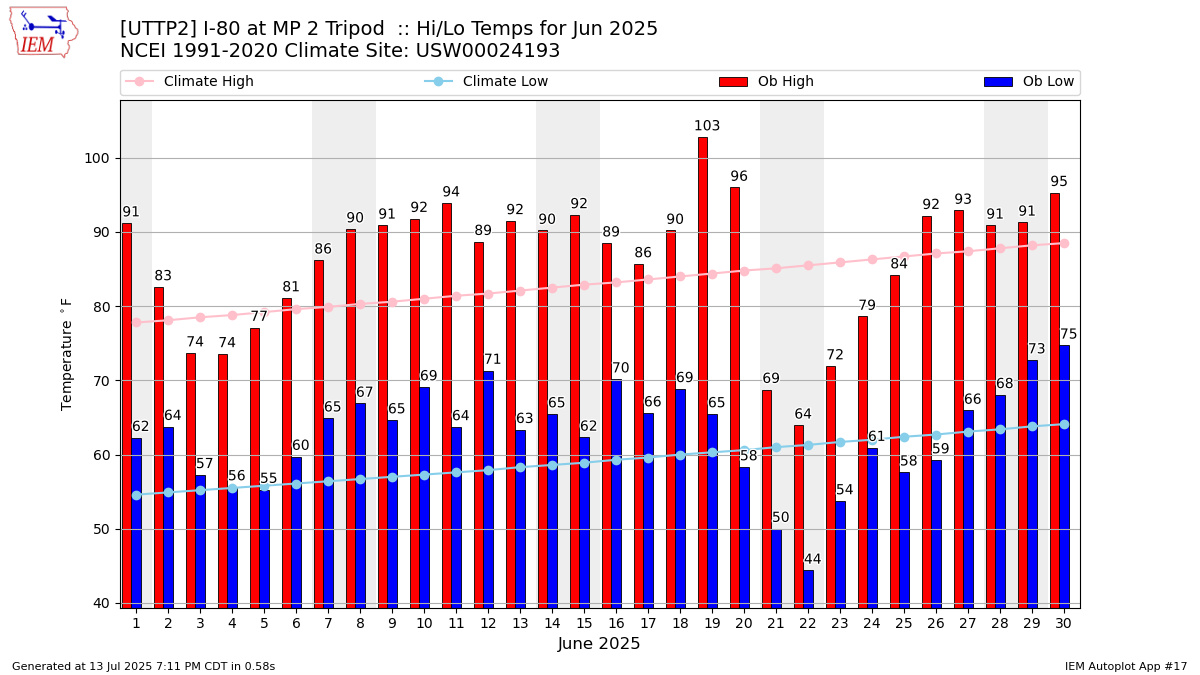
Description: This chart of the monthly temperature data. The bars are the observations and the dots are climatology.
Daily Rainfall
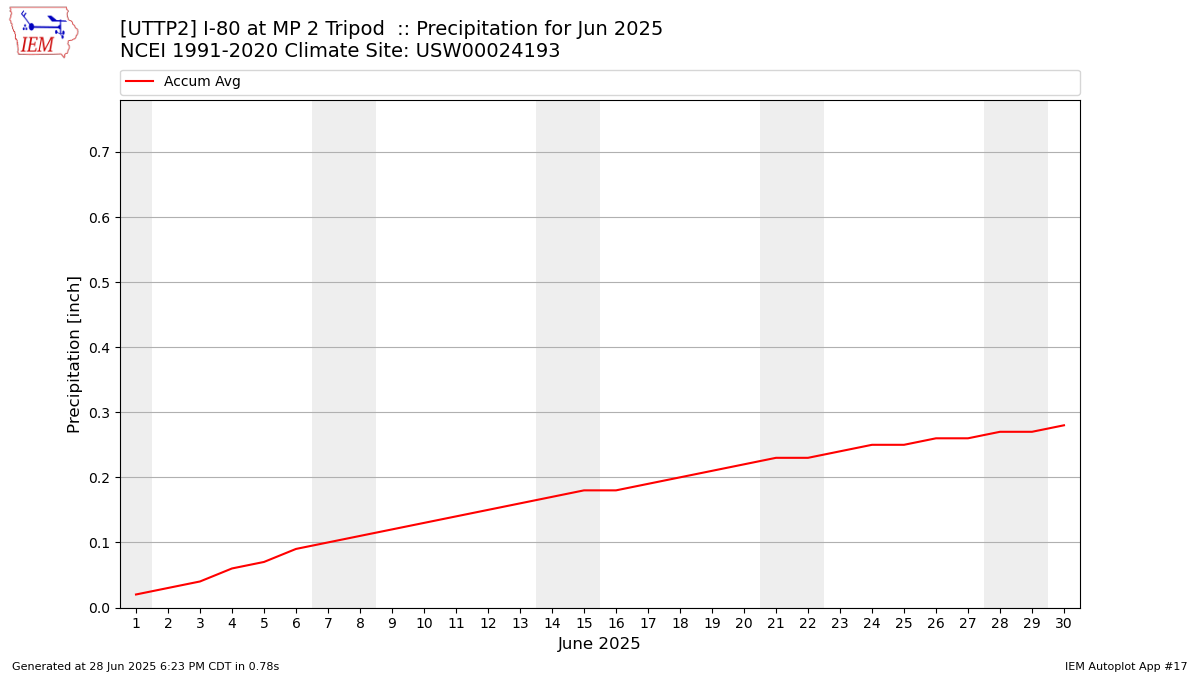
Description: This chart is of daily precipitation for the month. The red line would be an average month while the blue line and bars are observations.
Daily Average Wind Speeds
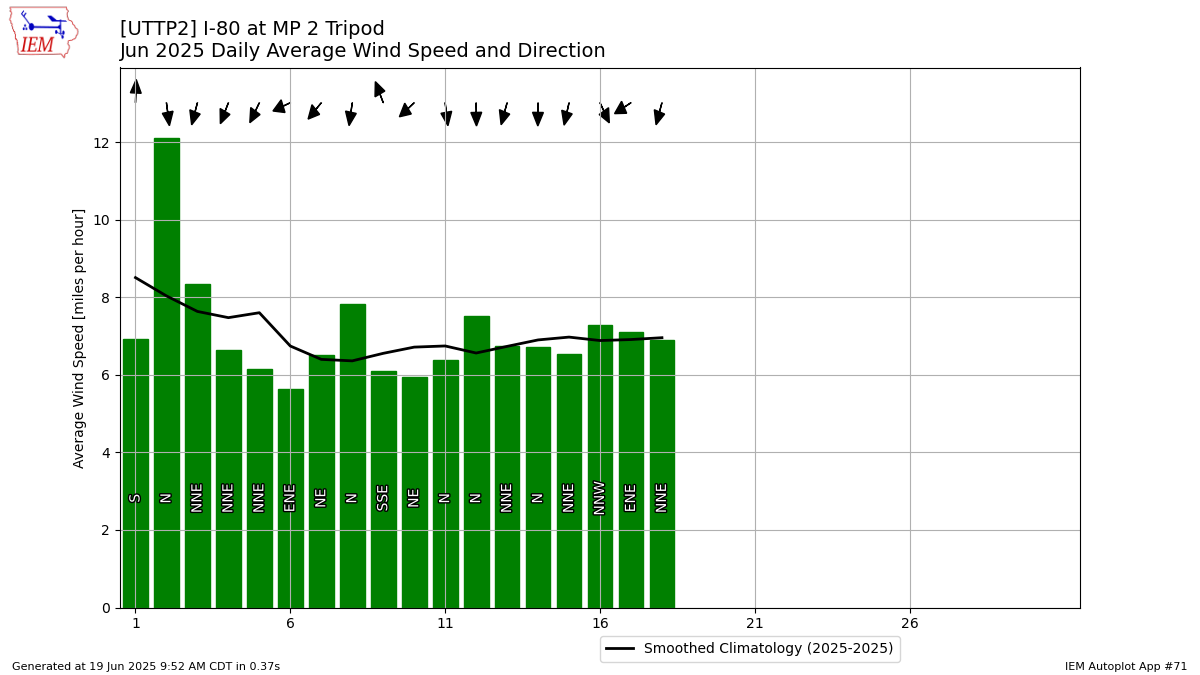
Description: This chart is of the daily average wind speeds.
The data presented here provided by IEM API webservice: daily.json. A simple CSV option exists as well.