| May 2025 | Jun 2025 | Jul 2025 | ||||
|---|---|---|---|---|---|---|
| Sunday | Monday | Tuesday | Wednesday | Thursday | Friday | Saturday |
| 01 High: 89.20042 Low: 61.930428 Precip: M Avg Wind: ESE @ 3.8 Gust: 25 (6:40 PM) RH% Min/Max: 11-37 Feel Min/Max: 62 to 85 | 02 High: 75.90921 Low: 56.609585 Precip: M Avg Wind: ENE @ 4.5 Gust: 18 (10:00 AM) RH% Min/Max: 14-64 Feel Min/Max: 57 to 76 | 03 High: 70.309425 Low: 48.000202 Precip: M Avg Wind: E @ 3.8 Gust: 19 (3:00 PM) RH% Min/Max: 17-57 Feel Min/Max: 46 to 70 | 04 High: 72.17963 Low: 49.11982 Precip: M Avg Wind: NE @ 4.6 Gust: 21 (4:50 PM) RH% Min/Max: 22-51 Feel Min/Max: 47 to 72 | 05 High: 73.81039 Low: 51.44002 Precip: M Avg Wind: E @ 3.5 Gust: 16 (3:10 PM) RH% Min/Max: 22-46 Feel Min/Max: 51 to 74 | 06 High: 75.979416 Low: 54.289383 Precip: M Avg Wind: ESE @ 3.9 Gust: 17 (3:10 PM) RH% Min/Max: 16-52 Feel Min/Max: 54 to 76 | 07 High: 81.10042 Low: 56.280212 Precip: M Avg Wind: ESE @ 3.7 Gust: 17 (1:50 PM) RH% Min/Max: 16-47 Feel Min/Max: 56 to 80 |
| 08 High: 83.49978 Low: 60.009796 Precip: M Avg Wind: ESE @ 4.2 Gust: 19 (4:20 PM) RH% Min/Max: 12-44 Feel Min/Max: 60 to 81 | 09 High: 86.7002 Low: 61.16001 Precip: M Avg Wind: ENE @ 4.1 Gust: 19 (3:40 PM) RH% Min/Max: 15-45 Feel Min/Max: 61 to 83 | 10 High: 86.7002 Low: 61.959213 Precip: M Avg Wind: ESE @ 3.7 Gust: 17 (3:50 AM) RH% Min/Max: 17-50 Feel Min/Max: 62 to 83 | 11 High: 88.80079 Low: 64.84999 Precip: M Avg Wind: NE @ 4.8 Gust: 27 (2:10 PM) RH% Min/Max: 11-45 Feel Min/Max: 65 to 85 | 12 High: 87.499405 Low: 63.06982 Precip: M Avg Wind: ENE @ 4.0 Gust: 32 (1:30 PM) RH% Min/Max: 11-50 Feel Min/Max: 63 to 84 | 13 High: 87.600204 Low: 63.260597 Precip: M Avg Wind: NNE @ 5.7 Gust: 38 (3:40 PM) RH% Min/Max: 7-38 Feel Min/Max: 63 to 83 | 14 High: 81.89962 Low: 64.74018 Precip: M Gust: 30 (12:00 AM) RH% Min/Max: 9-25 Feel Min/Max: 65 to 79 |
| 15 Precip: M | 16 | 17 | 18 | 19 | 20 | 21 |
| 22 | 23 | 24 | 25 | 26 | 27 | 28 |
| 29 | 30 | 01 | 02 | 03 | 04 | 05 |
The data presented here provided by IEM API webservice: daily.json. A simple CSV option exists as well.
Daily High/Low Plot
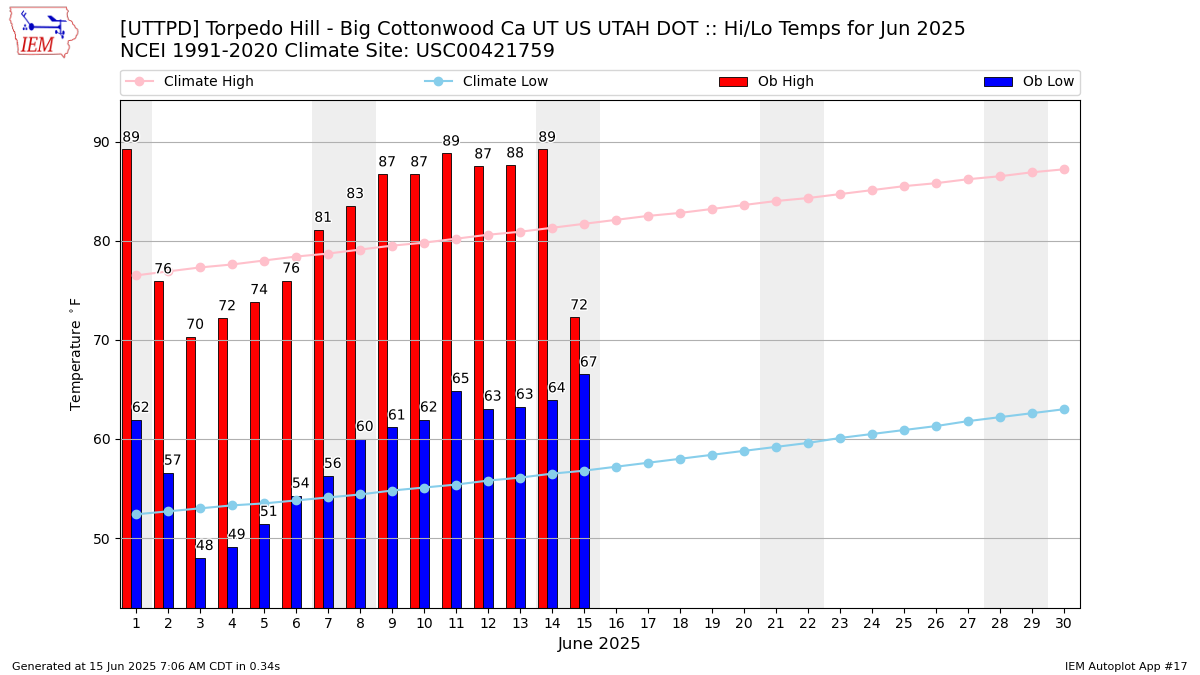
Description: This chart of the monthly temperature data. The bars are the observations and the dots are climatology.
Daily Rainfall
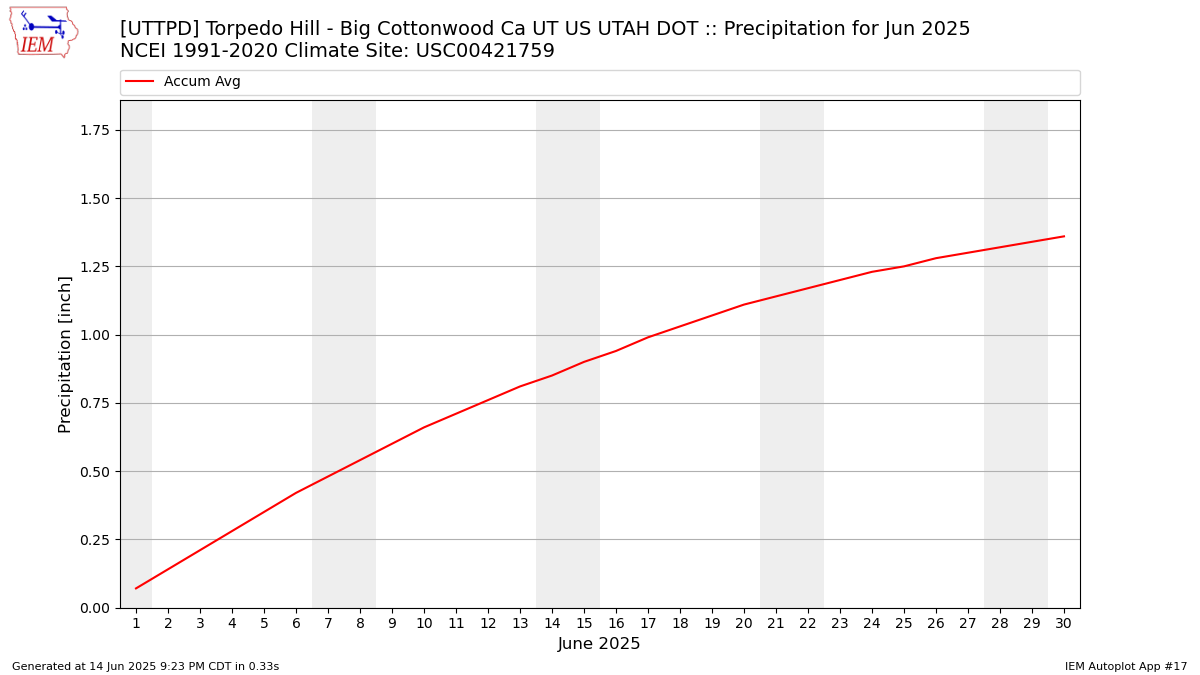
Description: This chart is of daily precipitation for the month. The red line would be an average month while the blue line and bars are observations.
Daily Average Wind Speeds
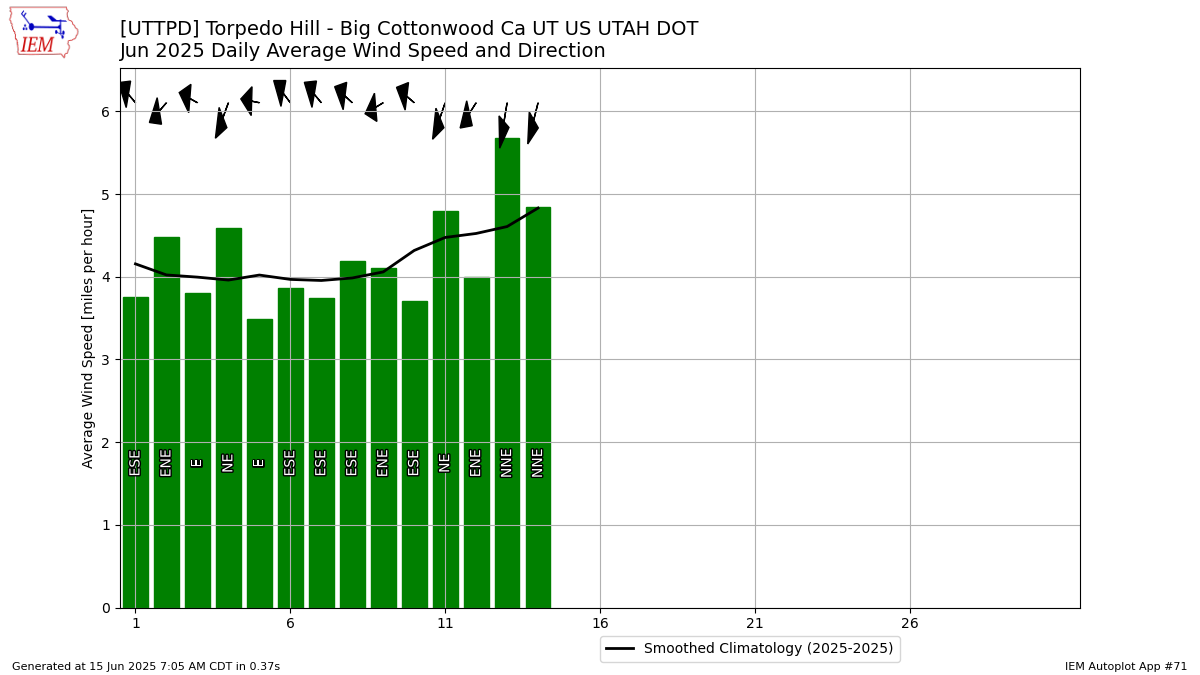
Description: This chart is of the daily average wind speeds.
The data presented here provided by IEM API webservice: daily.json. A simple CSV option exists as well.