| May 2025 | Jun 2025 | Jul 2025 | ||||
|---|---|---|---|---|---|---|
| Sunday | Monday | Tuesday | Wednesday | Thursday | Friday | Saturday |
| 01 High: 90.49999 Low: 59.199776 Precip: M Avg Wind: ENE @ 7.7 Gust: 34 (1:20 AM) RH% Min/Max: 18-55 Feel Min/Max: 59 to 87 | 02 High: 74.4494 Low: 56.969604 Precip: M Avg Wind: N @ 4.8 Gust: 18 (7:20 PM) RH% Min/Max: 19-51 Feel Min/Max: 57 to 74 | 03 High: 71.690025 Low: 45.550415 Precip: M Avg Wind: E @ 7.0 Gust: 22 (6:50 AM) RH% Min/Max: 26-51 Feel Min/Max: 39 to 72 | 04 High: 74.1308 Low: 45.219177 Precip: M Avg Wind: ENE @ 6.2 Gust: 23 (6:20 AM) RH% Min/Max: 20-59 Feel Min/Max: 40 to 74 | 05 High: 78.299614 Low: 49.139595 Precip: M Avg Wind: ENE @ 7.4 Gust: 26 (6:40 AM) RH% Min/Max: 19-56 Feel Min/Max: 43 to 78 | 06 High: 80.00063 Low: 53.349777 Precip: M Avg Wind: E @ 6.6 Gust: 27 (3:30 AM) RH% Min/Max: 23-63 Feel Min/Max: 53 to 79 | 07 High: 85.09999 Low: 53.99962 Precip: M Avg Wind: ENE @ 8.7 Gust: 28 (6:20 AM) RH% Min/Max: 22-50 Feel Min/Max: 54 to 82 |
| 08 High: 87.09978 Low: 56.4494 Precip: M Avg Wind: ENE @ 7.6 Gust: 30 (1:50 AM) RH% Min/Max: 23-58 Feel Min/Max: 56 to 84 | 09 High: 90.60079 Low: 57.450203 Precip: M Avg Wind: E @ 7.7 Gust: 31 (5:20 AM) RH% Min/Max: 9-52 Feel Min/Max: 57 to 86 | 10 High: 90.39919 Low: 59.0792 Precip: M Avg Wind: ENE @ 7.8 Gust: 33 (4:30 AM) RH% Min/Max: 16-50 Feel Min/Max: 59 to 87 | 11 High: 93.19999 Low: 61.170776 Precip: M Avg Wind: E @ 8.1 Gust: 31 (5:50 PM) RH% Min/Max: 19-61 Feel Min/Max: 61 to 90 | 12 High: 89.00063 Low: 58.719177 Precip: M Avg Wind: ESE @ 6.7 Gust: 29 (3:00 AM) RH% Min/Max: 24-61 Feel Min/Max: 59 to 86 | 13 High: 89.90057 Low: 55.95079 Precip: M Avg Wind: SSE @ 5.7 Gust: 28 (11:30 PM) RH% Min/Max: 18-75 Feel Min/Max: 56 to 86 | 14 High: 91.00042 Low: 59.439224 Precip: M Avg Wind: E @ 9.0 Gust: 31 (6:50 AM) RH% Min/Max: 15-46 Feel Min/Max: 59 to 87 |
| 15 High: 91.90041 Low: 57.46998 Precip: M Gust: 28 (3:20 AM) RH% Min/Max: 12-53 Feel Min/Max: 57 to 88 | 16 Precip: M | 17 | 18 | 19 | 20 | 21 |
| 22 | 23 | 24 | 25 | 26 | 27 | 28 |
| 29 | 30 | 01 | 02 | 03 | 04 | 05 |
The data presented here provided by IEM API webservice: daily.json. A simple CSV option exists as well.
Daily High/Low Plot
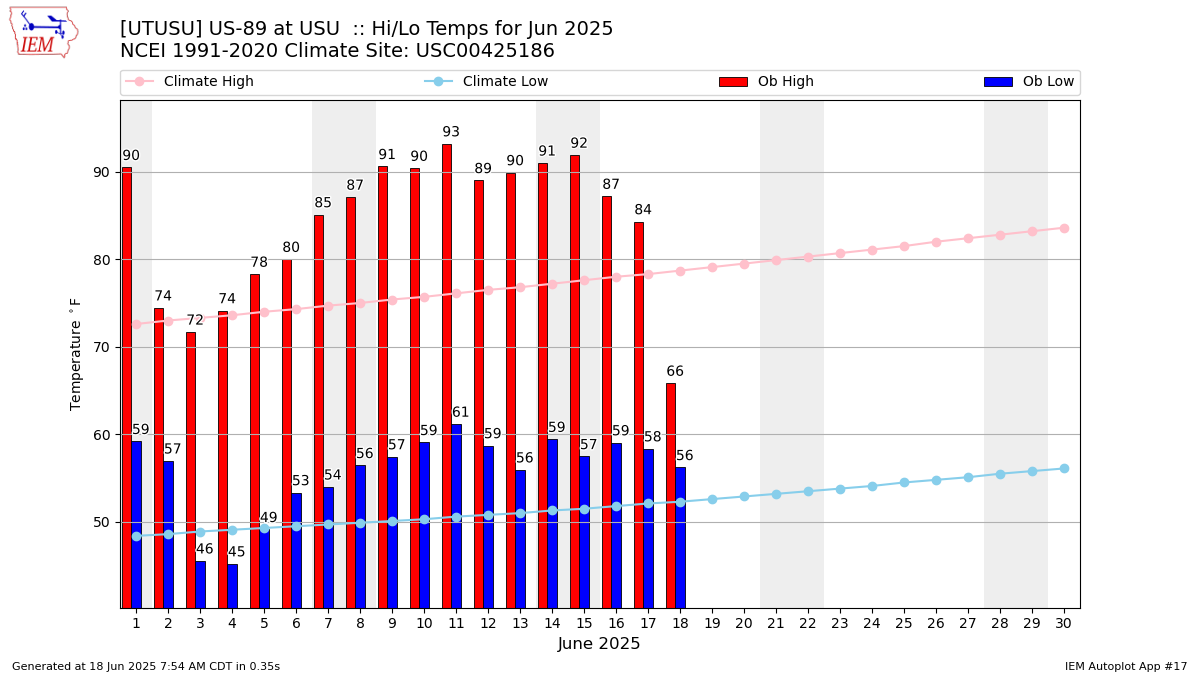
Description: This chart of the monthly temperature data. The bars are the observations and the dots are climatology.
Daily Rainfall
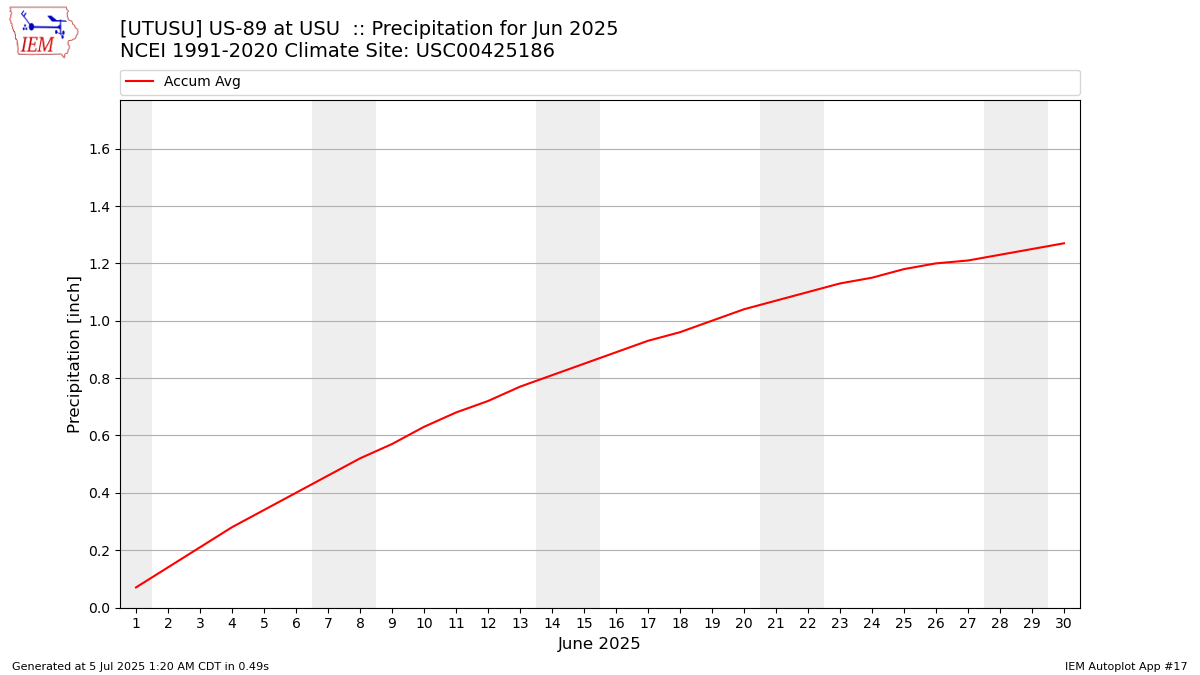
Description: This chart is of daily precipitation for the month. The red line would be an average month while the blue line and bars are observations.
Daily Average Wind Speeds
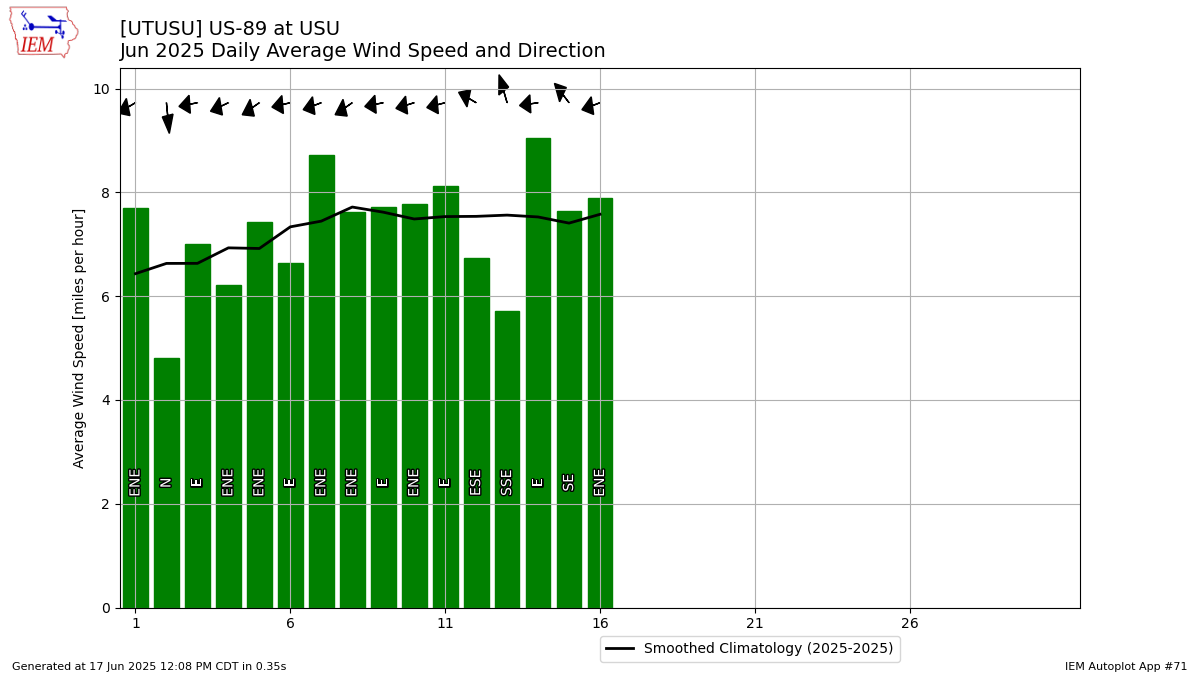
Description: This chart is of the daily average wind speeds.
The data presented here provided by IEM API webservice: daily.json. A simple CSV option exists as well.