| May 2025 | Jun 2025 | Jul 2025 | ||||
|---|---|---|---|---|---|---|
| Sunday | Monday | Tuesday | Wednesday | Thursday | Friday | Saturday |
| 01 High: 94.40057 Low: 55.149776 Precip: M Avg Wind: NNW @ 5.1 Gust: 23 (9:00 PM) RH% Min/Max: 11-76 Feel Min/Max: 55 to 90 | 02 High: 80.70079 Low: 64.509796 Precip: M Avg Wind: NNW @ 7.2 Gust: 22 (12:30 PM) RH% Min/Max: 12-53 Feel Min/Max: 65 to 80 | 03 High: 74.49978 Low: 48.77957 Precip: M Avg Wind: WNW @ 4.8 Gust: 21 (2:50 PM) RH% Min/Max: 16-59 Feel Min/Max: 49 to 74 | 04 High: 75.4106 Low: 49.890182 Precip: M Avg Wind: NW @ 4.7 Gust: 19 (2:50 PM) RH% Min/Max: 16-66 Feel Min/Max: 50 to 75 | 05 High: 79.199615 Low: 46.819393 Precip: M Avg Wind: NNW @ 4.1 Gust: 16 (5:20 PM) RH% Min/Max: 14-75 Feel Min/Max: 44 to 79 | 06 High: 81.49999 Low: 55.610596 Precip: M Avg Wind: S @ 5.1 Gust: 21 (12:30 PM) RH% Min/Max: 15-58 Feel Min/Max: 56 to 80 | 07 High: 85.60042 Low: 52.480427 Precip: M Avg Wind: WNW @ 4.4 Gust: 18 (4:30 PM) RH% Min/Max: 15-69 Feel Min/Max: 52 to 82 |
| 08 High: 90.3002 Low: 58.11982 Precip: M Avg Wind: NW @ 3.6 Gust: 16 (2:40 PM) RH% Min/Max: 13-68 Feel Min/Max: 58 to 86 | 09 High: 92.800415 Low: 58.749775 Precip: M Avg Wind: NW @ 4.2 Gust: 18 (3:00 PM) RH% Min/Max: 9-68 Feel Min/Max: 59 to 88 | 10 High: 94.20079 Low: 56.390022 Precip: M Avg Wind: NNW @ 4.0 Gust: 17 (2:20 AM) RH% Min/Max: 13-61 Feel Min/Max: 56 to 90 | 11 High: 98.20042 Low: 62.94919 Precip: M Avg Wind: WNW @ 7.0 Gust: 32 (7:30 PM) RH% Min/Max: 11-58 Feel Min/Max: 63 to 94 | 12 High: 93.39983 Low: 62.920406 Precip: M Avg Wind: N @ 4.1 Gust: 18 (2:40 AM) RH% Min/Max: 17-71 Feel Min/Max: 63 to 90 | 13 High: 94.99999 Low: 62.569393 Precip: M Avg Wind: S @ 5.3 Gust: 17 (3:50 PM) RH% Min/Max: 12-74 Feel Min/Max: 63 to 91 | 14 High: 71.78 Low: 68.18 Precip: M Gust: 6 (1:20 AM) RH% Min/Max: 29-45 Feel Min/Max: 68 to 72 |
| 15 Precip: M | 16 | 17 | 18 | 19 | 20 | 21 |
| 22 | 23 | 24 | 25 | 26 | 27 | 28 |
| 29 | 30 | 01 | 02 | 03 | 04 | 05 |
The data presented here provided by IEM API webservice: daily.json. A simple CSV option exists as well.
Daily High/Low Plot
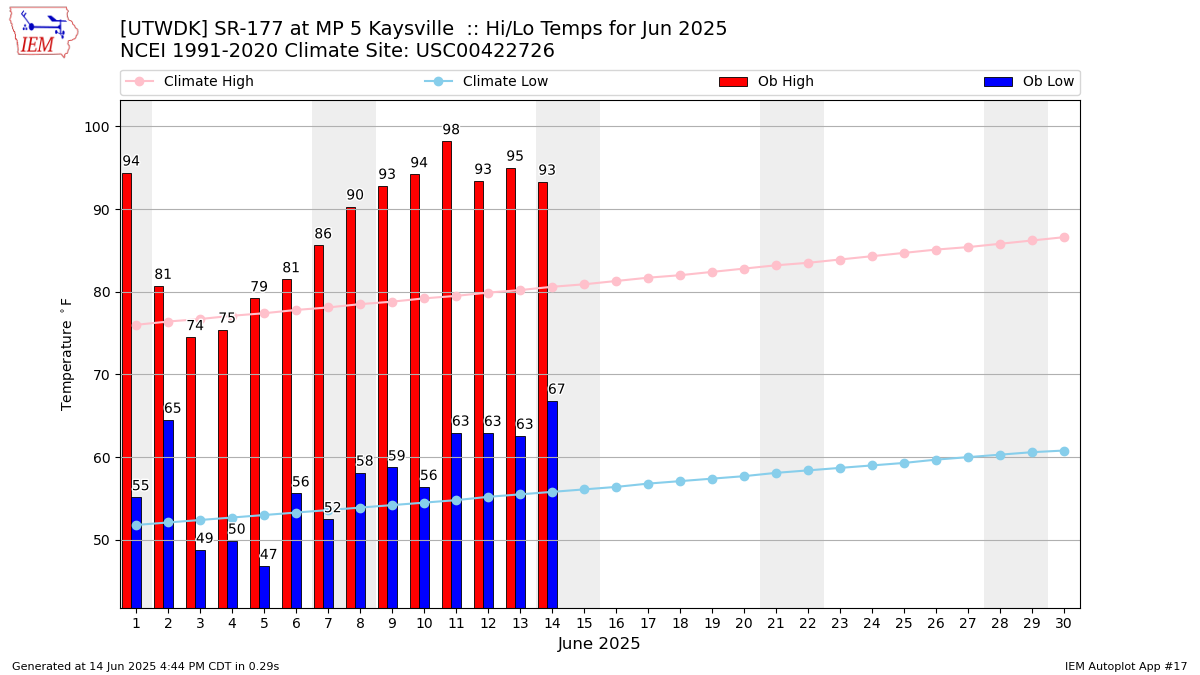
Description: This chart of the monthly temperature data. The bars are the observations and the dots are climatology.
Daily Rainfall
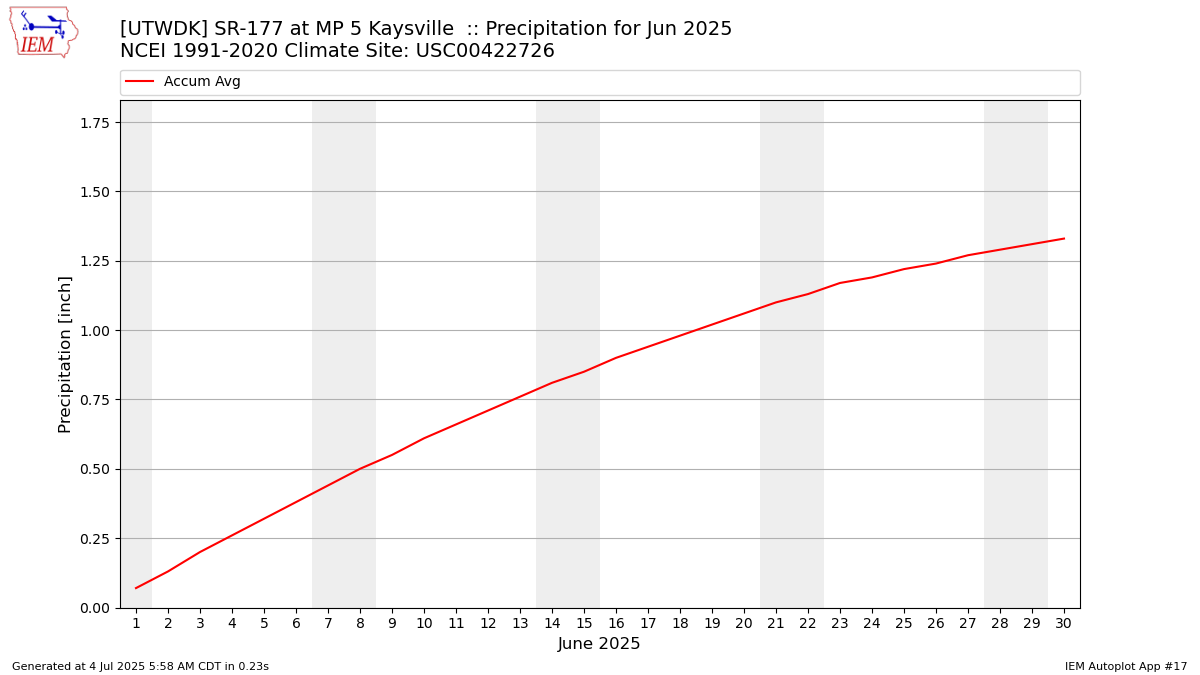
Description: This chart is of daily precipitation for the month. The red line would be an average month while the blue line and bars are observations.
Daily Average Wind Speeds
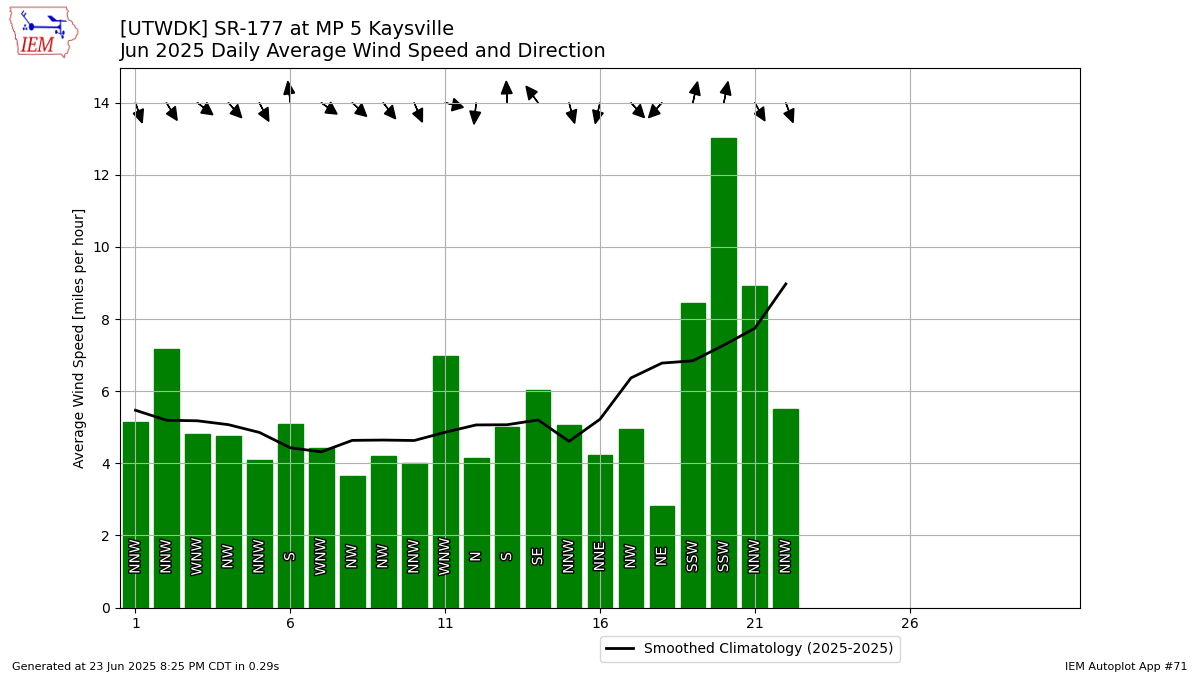
Description: This chart is of the daily average wind speeds.
The data presented here provided by IEM API webservice: daily.json. A simple CSV option exists as well.