| May 2025 | Jun 2025 | Jul 2025 | ||||
|---|---|---|---|---|---|---|
| Sunday | Monday | Tuesday | Wednesday | Thursday | Friday | Saturday |
| 01 High: 57.340393 Low: 44.589222 Precip: M Gust: 25 (6:15 AM) RH% Min/Max: 56-91 Feel Min/Max: 39 to 57 | 02 High: 64.500786 Low: 44.549618 Precip: M Gust: 24 (12:45 PM) RH% Min/Max: 35-95 Feel Min/Max: 44 to 65 | 03 High: 77.01081 Low: 37.430588 Precip: M Gust: 13 (1:25 PM) RH% Min/Max: 26-96 Feel Min/Max: 37 to 77 | 04 High: 84.19999 Low: 47.5502 Precip: M Gust: 15 (12:15 PM) RH% Min/Max: 39-92 Feel Min/Max: 48 to 83 | 05 High: 87.000786 Low: 56.370193 Precip: M Gust: 18 (7:40 PM) RH% Min/Max: 40-95 Feel Min/Max: 56 to 88 | 06 High: 74.71939 Low: 60.409424 Precip: M Gust: 9 (6:10 AM) RH% Min/Max: 68-96 Feel Min/Max: 60 to 75 | 07 High: 69.1502 Low: 56.400787 Precip: M Gust: 15 (5:05 PM) RH% Min/Max: 75-97 Feel Min/Max: 56 to 69 |
| 08 High: 75.759796 Low: 51.200577 Precip: M Gust: 14 (2:45 PM) RH% Min/Max: 36-97 Feel Min/Max: 51 to 76 | 09 High: 67.949615 Low: 56.8292 Precip: M Gust: 19 (2:25 PM) RH% Min/Max: 52-96 Feel Min/Max: 57 to 68 | 10 High: 68.5598 Low: 55.29919 Precip: M Gust: 15 (3:45 PM) RH% Min/Max: 79-96 Feel Min/Max: 55 to 69 | 11 High: 73.76001 Low: 49.659798 Precip: M Gust: 21 (11:50 AM) RH% Min/Max: 49-97 Feel Min/Max: 50 to 74 | 12 High: 72.719604 Low: 53.130215 Precip: M Gust: 28 (5:35 PM) RH% Min/Max: 46-94 Feel Min/Max: 53 to 73 | 13 High: 65.26038 Low: 49.49962 Precip: M Gust: 17 (9:30 AM) RH% Min/Max: 46-83 Feel Min/Max: 48 to 65 | 14 High: 70.98981 Low: 48.050575 Precip: M Gust: 11 (1:15 PM) RH% Min/Max: 34-96 Feel Min/Max: 48 to 71 |
| 15 High: 72.710594 Low: 45.7808 Precip: M Gust: 14 (10:55 AM) RH% Min/Max: 48-94 Feel Min/Max: 46 to 73 | 16 High: 77.790184 Low: 43.989807 Precip: M Gust: 23 (4:25 PM) RH% Min/Max: 46-94 Feel Min/Max: 44 to 78 | 17 High: 68.64983 Low: 56.82019 Precip: M Gust: 21 (5:30 PM) RH% Min/Max: 66-95 Feel Min/Max: 57 to 69 | 18 High: 79.82062 Low: 62.85921 Precip: M Gust: 19 (2:15 PM) RH% Min/Max: 69-97 Feel Min/Max: 63 to 80 | 19 High: 87.79999 Low: 68.18 Precip: M Gust: 20 (5:00 PM) RH% Min/Max: 48-94 Feel Min/Max: 68 to 91 | 20 Precip: M | 21 |
| 22 | 23 | 24 | 25 | 26 | 27 | 28 |
| 29 | 30 | 01 | 02 | 03 | 04 | 05 |
The data presented here provided by IEM API webservice: daily.json. A simple CSV option exists as well.
Daily High/Low Plot
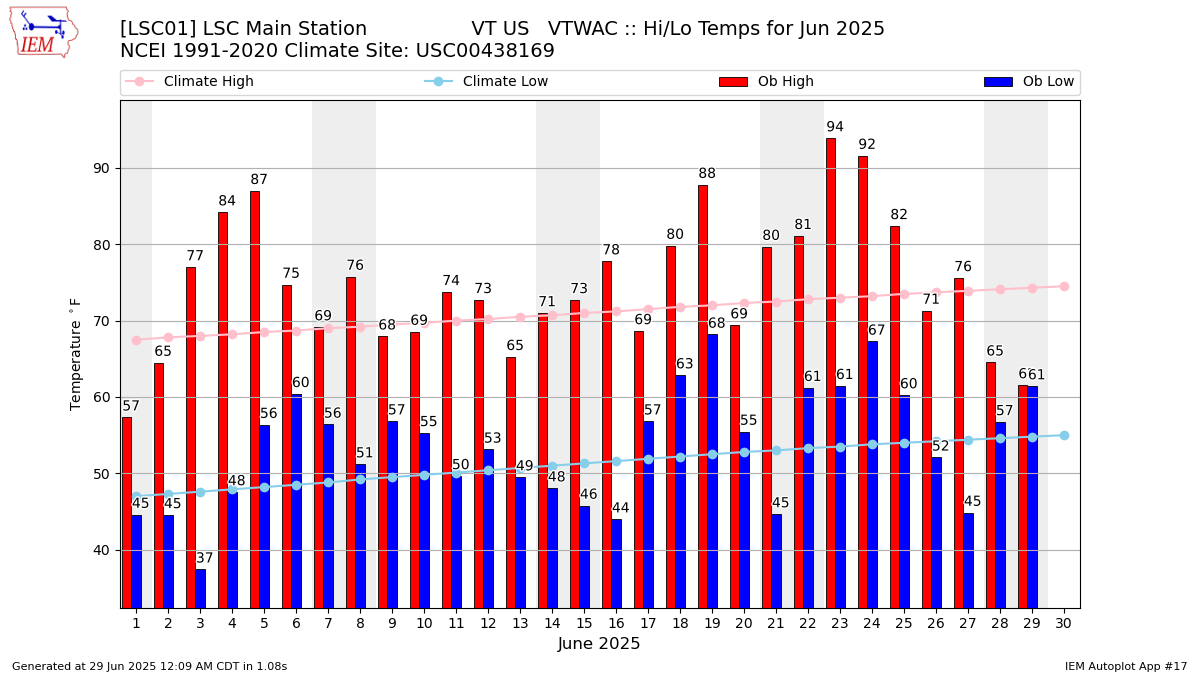
Description: This chart of the monthly temperature data. The bars are the observations and the dots are climatology.
Daily Rainfall
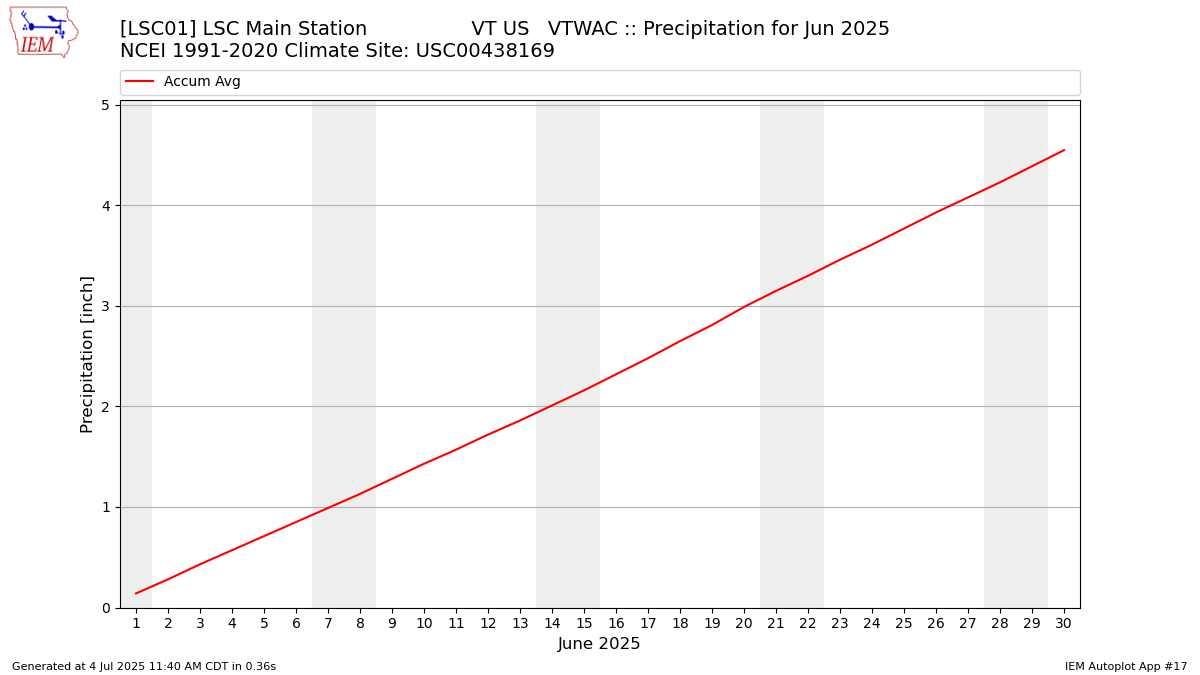
Description: This chart is of daily precipitation for the month. The red line would be an average month while the blue line and bars are observations.
Daily Average Wind Speeds
Description: This chart is of the daily average wind speeds.
The data presented here provided by IEM API webservice: daily.json. A simple CSV option exists as well.