| May 2025 | Jun 2025 | Jul 2025 | ||||
|---|---|---|---|---|---|---|
| Sunday | Monday | Tuesday | Wednesday | Thursday | Friday | Saturday |
| 01 High: 75.4808 Low: 34.019608 Precip: M Avg Wind: NW @ 0.8 RH% Min/Max: 23-95 Feel Min/Max: 34 to 75 | 02 High: 84.34039 Low: 42.909798 Precip: M Avg Wind: SSW @ 2.5 RH% Min/Max: 33-91 Feel Min/Max: 43 to 83 | 03 High: 80.380424 Low: 57.570778 Precip: M Avg Wind: SW @ 4.8 RH% Min/Max: 61-92 Feel Min/Max: 58 to 82 | 04 High: 77.64983 Low: 48.390823 Precip: M Avg Wind: NNW @ 1.6 RH% Min/Max: 29-93 Feel Min/Max: 48 to 78 | 05 High: 81.46038 Low: 42.760384 Precip: M Avg Wind: N @ 0.0 RH% Min/Max: 27-95 Feel Min/Max: 43 to 80 | 06 High: 75.7904 Low: 58.47078 Precip: M Avg Wind: NNW @ 0.7 RH% Min/Max: 38-84 Feel Min/Max: 58 to 76 | 07 High: 78.06023 Low: 51.909798 Precip: M Avg Wind: S @ 0.4 RH% Min/Max: 40-85 Feel Min/Max: 52 to 78 |
| 08 High: 71.630585 Low: 47.64919 Precip: M Avg Wind: WSW @ 2.2 RH% Min/Max: 46-93 Feel Min/Max: 48 to 72 | 09 High: 63.51982 Low: 48.75079 Precip: M Avg Wind: WNW @ 3.7 RH% Min/Max: 59-92 Feel Min/Max: 49 to 63 | 10 High: 69.96918 Low: 51.34999 Precip: M Avg Wind: WNW @ 2.6 RH% Min/Max: 56-93 Feel Min/Max: 51 to 70 | 11 High: 81.939224 Low: 47.8292 Precip: M Avg Wind: NW @ 2.7 RH% Min/Max: 34-97 Feel Min/Max: 48 to 82 | 12 High: 73.00042 Low: 56.64919 Precip: M Avg Wind: E @ 0.2 RH% Min/Max: 48-92 Feel Min/Max: 57 to 73 | 13 High: 62.94919 Low: 52.48938 Precip: M Avg Wind: E @ 0.7 RH% Min/Max: 57-85 Feel Min/Max: 52 to 63 | 14 High: 80.97078 Low: 51.99082 Precip: M Avg Wind: S @ 0.6 RH% Min/Max: 54-88 Feel Min/Max: 52 to 82 |
| 15 High: 75.63021 Low: 55.479202 Precip: M Avg Wind: SSE @ 0.2 RH% Min/Max: 62-91 Feel Min/Max: 55 to 76 | 16 High: 78.769394 Low: 56.31982 Precip: M Avg Wind: SSW @ 1.4 RH% Min/Max: 69-94 Feel Min/Max: 56 to 79 | 17 High: 83.31982 Low: 65.5502 Precip: M Avg Wind: NW @ 2.7 RH% Min/Max: 49-93 Feel Min/Max: 66 to 84 | 18 High: 66.83 Low: 66.4502 Precip: M RH% Min/Max: 86-87 Feel Min/Max: 66 to 67 | 19 Precip: M | 20 | 21 |
| 22 | 23 | 24 | 25 | 26 | 27 | 28 |
| 29 | 30 | 01 | 02 | 03 | 04 | 05 |
The data presented here provided by IEM API webservice: daily.json. A simple CSV option exists as well.
Daily High/Low Plot
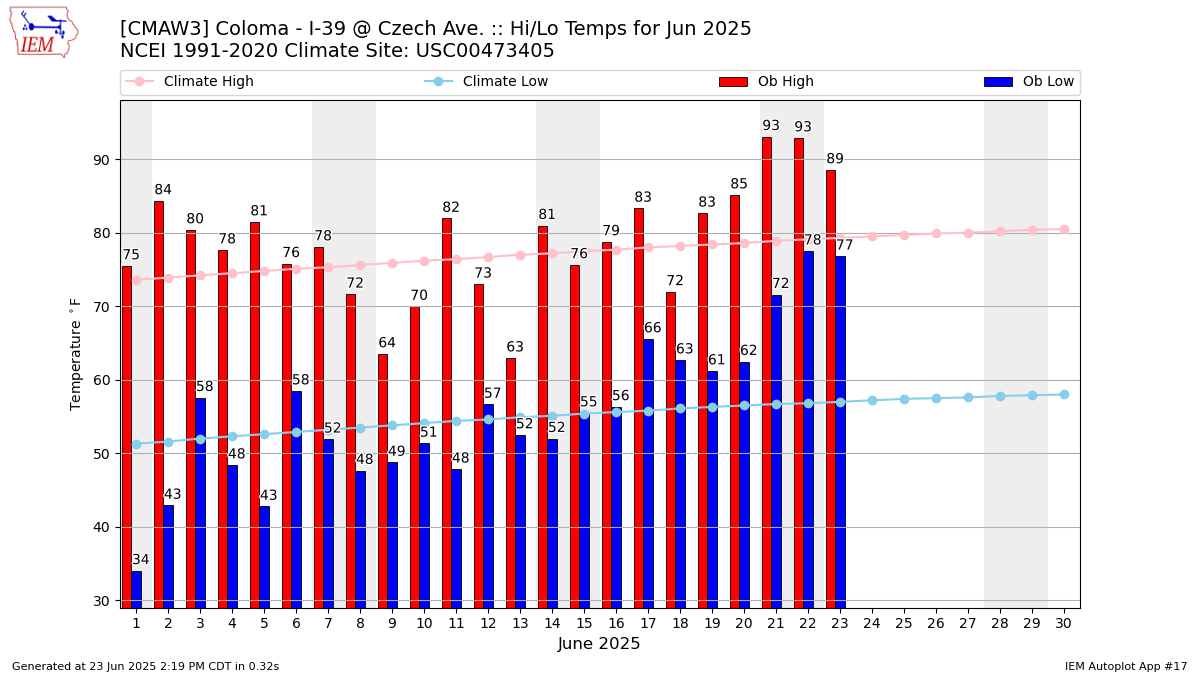
Description: This chart of the monthly temperature data. The bars are the observations and the dots are climatology.
Daily Rainfall
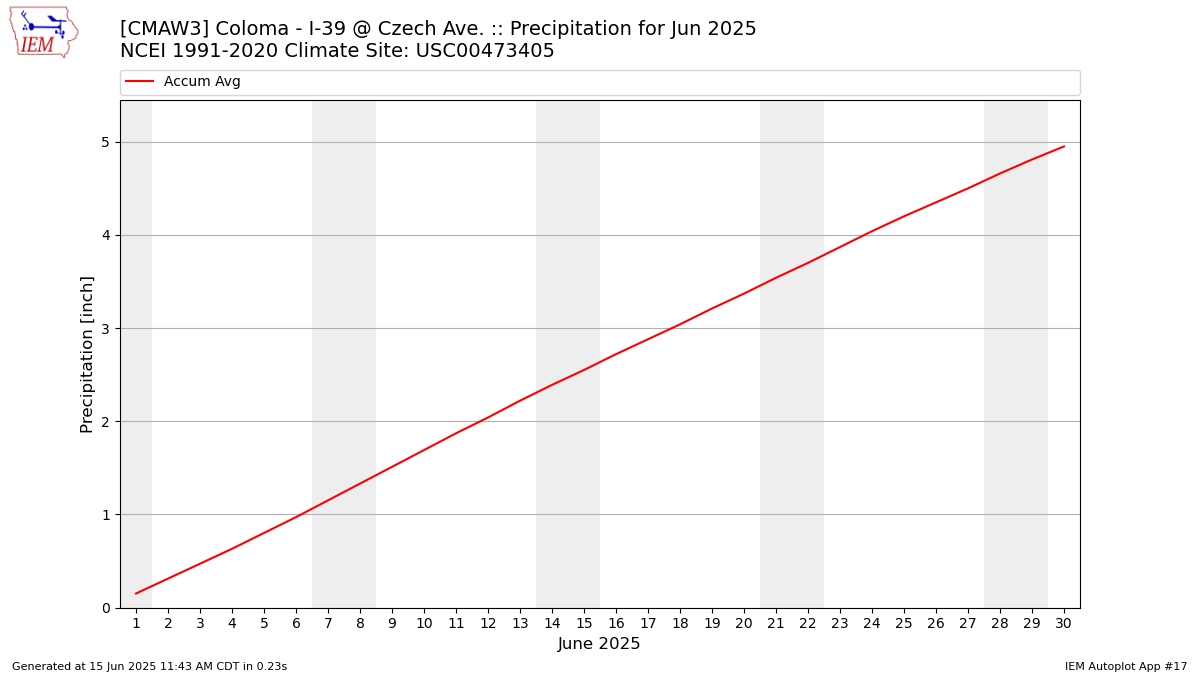
Description: This chart is of daily precipitation for the month. The red line would be an average month while the blue line and bars are observations.
Daily Average Wind Speeds
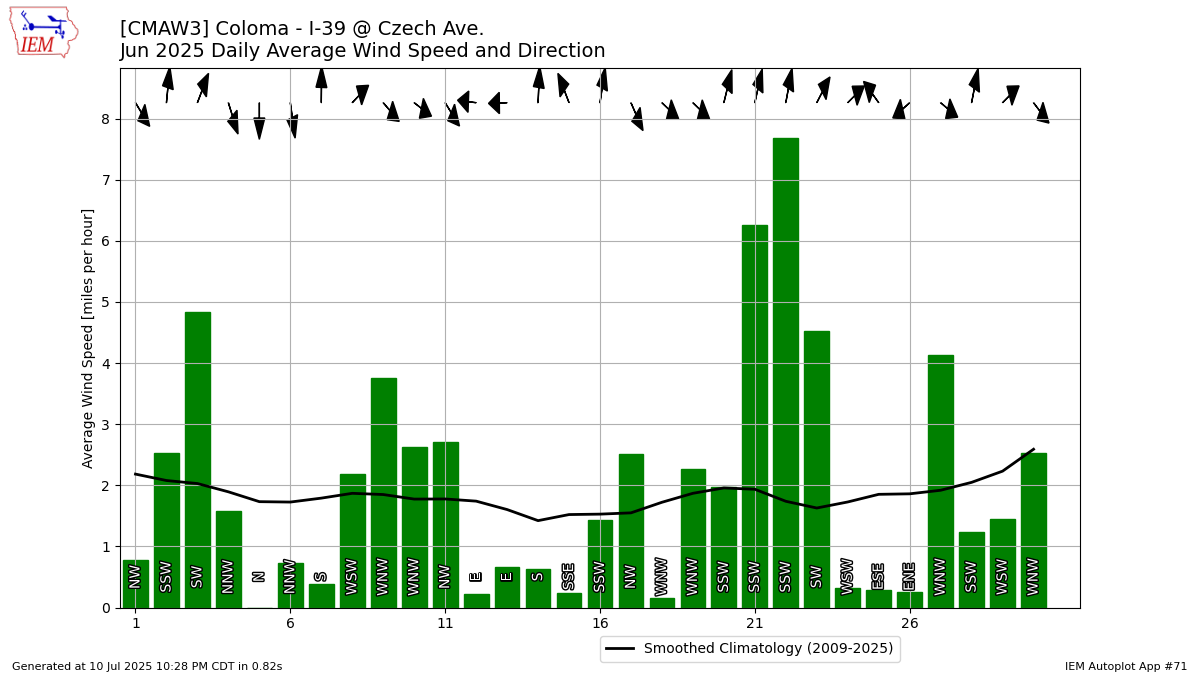
Description: This chart is of the daily average wind speeds.
The data presented here provided by IEM API webservice: daily.json. A simple CSV option exists as well.