| May 2025 | Jun 2025 | Jul 2025 | ||||
|---|---|---|---|---|---|---|
| Sunday | Monday | Tuesday | Wednesday | Thursday | Friday | Saturday |
| 01 High: 78.710014 Low: 36.759212 Precip: M Avg Wind: NE @ 2.7 RH% Min/Max: 19-98 Feel Min/Max: 31 to 79 | 02 High: 87.06023 Low: 56.350418 Precip: M Avg Wind: WSW @ 1.1 RH% Min/Max: 22-98 Feel Min/Max: 56 to 84 | 03 High: 60.760384 Low: 49.040607 Precip: M Avg Wind: WNW @ 1.3 RH% Min/Max: 62-98 Feel Min/Max: 47 to 61 | 04 High: 72.809586 Low: 41.199776 Precip: M Avg Wind: W @ 2.4 RH% Min/Max: 13-98 Feel Min/Max: 41 to 73 | 05 High: 78.380585 Low: 39.64999 Precip: M Avg Wind: WSW @ 1.9 RH% Min/Max: 12-98 Feel Min/Max: 39 to 78 | 06 High: 67.2098 Low: 53.24002 Precip: M Avg Wind: N @ 2.9 RH% Min/Max: 36-97 Feel Min/Max: 53 to 67 | 07 High: 76.3808 Low: 48.9308 Precip: M Avg Wind: ENE @ 0.9 RH% Min/Max: 29-98 Feel Min/Max: 48 to 76 |
| 08 High: 65.62041 Low: 49.060383 Precip: M Avg Wind: WSW @ 5.7 RH% Min/Max: 31-98 Feel Min/Max: 44 to 66 | 09 High: 61.80079 Low: 45.660225 Precip: M Avg Wind: W @ 4.2 RH% Min/Max: 43-98 Feel Min/Max: 42 to 62 | 10 High: 76.87041 Low: 50.28981 Precip: M Avg Wind: WSW @ 2.4 RH% Min/Max: 27-96 Feel Min/Max: 50 to 77 | 11 High: 70.75942 Low: 50.129627 Precip: M Avg Wind: W @ 4.6 RH% Min/Max: 33-98 Feel Min/Max: 50 to 71 | 12 High: 65.66001 Low: 46.63043 Precip: M Avg Wind: ENE @ 5.0 RH% Min/Max: 35-98 Feel Min/Max: 41 to 66 | 13 High: 51.4292 Low: 45.78981 Precip: M Avg Wind: ENE @ 4.8 RH% Min/Max: 93-98 Feel Min/Max: 41 to 51 | 14 High: 56.620407 Low: 44.78 Precip: M Avg Wind: ENE @ 3.9 RH% Min/Max: 82-98 Feel Min/Max: 41 to 57 |
| 15 High: 66.11001 Low: 49.240395 Precip: M Avg Wind: ENE @ 2.0 RH% Min/Max: 68-98 Feel Min/Max: 48 to 66 | 16 High: 78.600204 Low: 56.539383 Precip: M Avg Wind: S @ 1.9 RH% Min/Max: 55-98 Feel Min/Max: 57 to 79 | 17 High: 74.87062 Low: 55.6808 Precip: M RH% Min/Max: 42-98 Feel Min/Max: 56 to 75 | 18 Precip: M | 19 | 20 | 21 |
| 22 | 23 | 24 | 25 | 26 | 27 | 28 |
| 29 | 30 | 01 | 02 | 03 | 04 | 05 |
The data presented here provided by IEM API webservice: daily.json. A simple CSV option exists as well.
Daily High/Low Plot
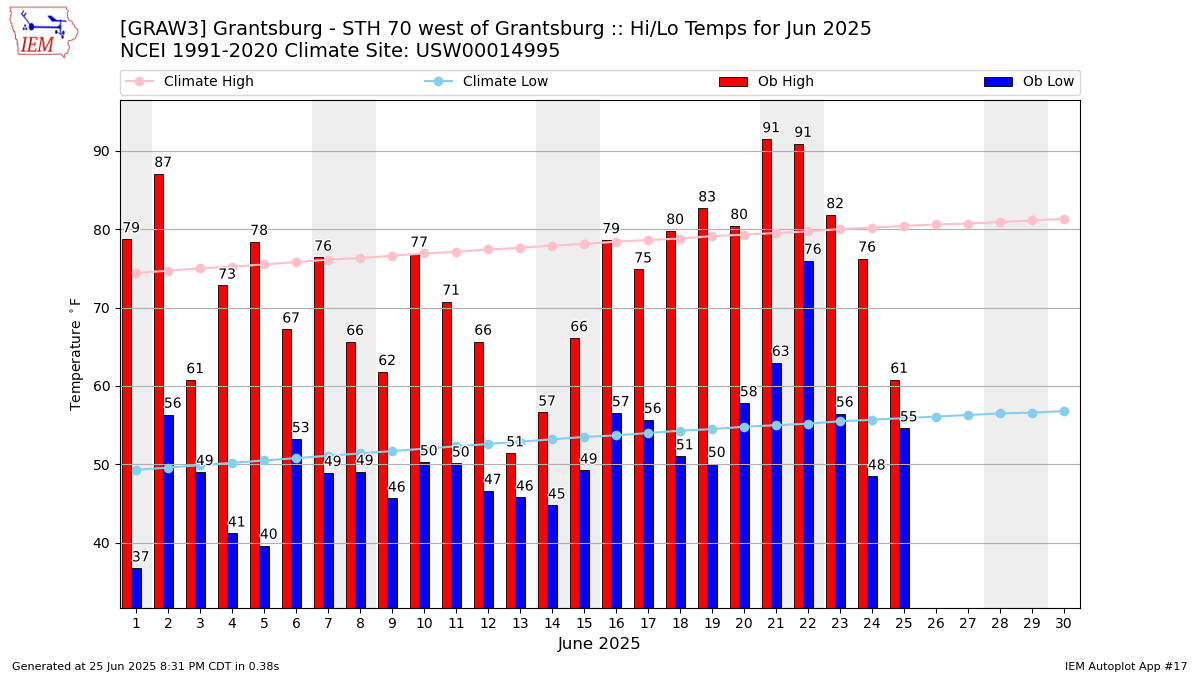
Description: This chart of the monthly temperature data. The bars are the observations and the dots are climatology.
Daily Rainfall
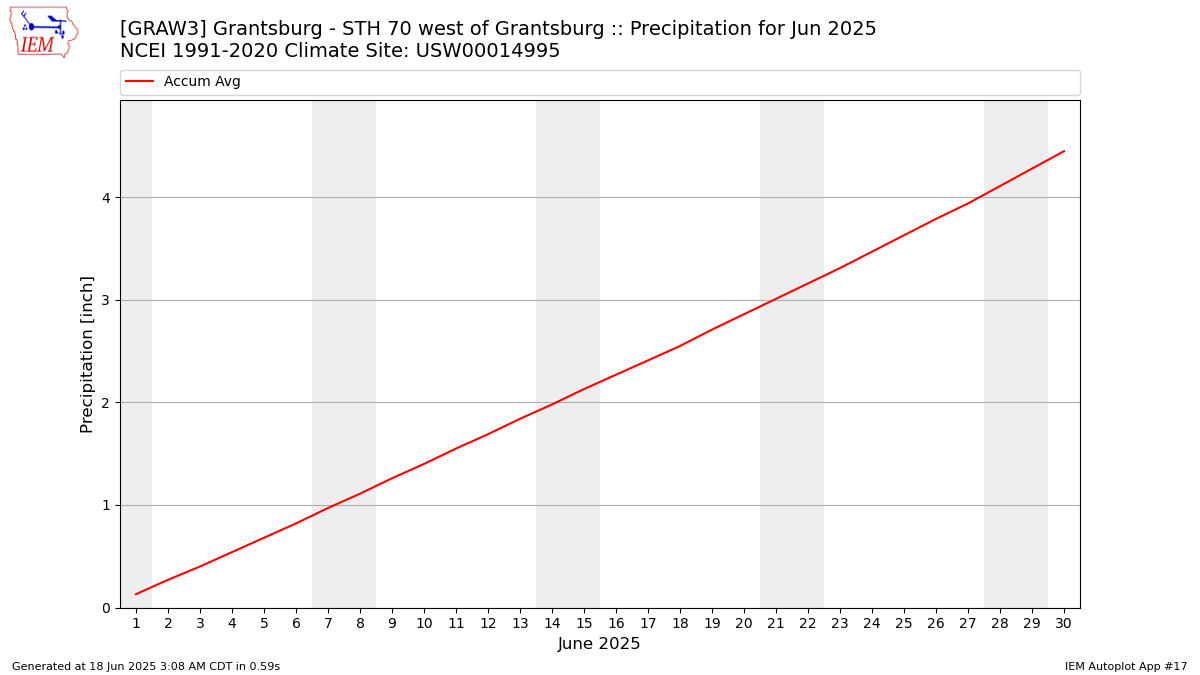
Description: This chart is of daily precipitation for the month. The red line would be an average month while the blue line and bars are observations.
Daily Average Wind Speeds
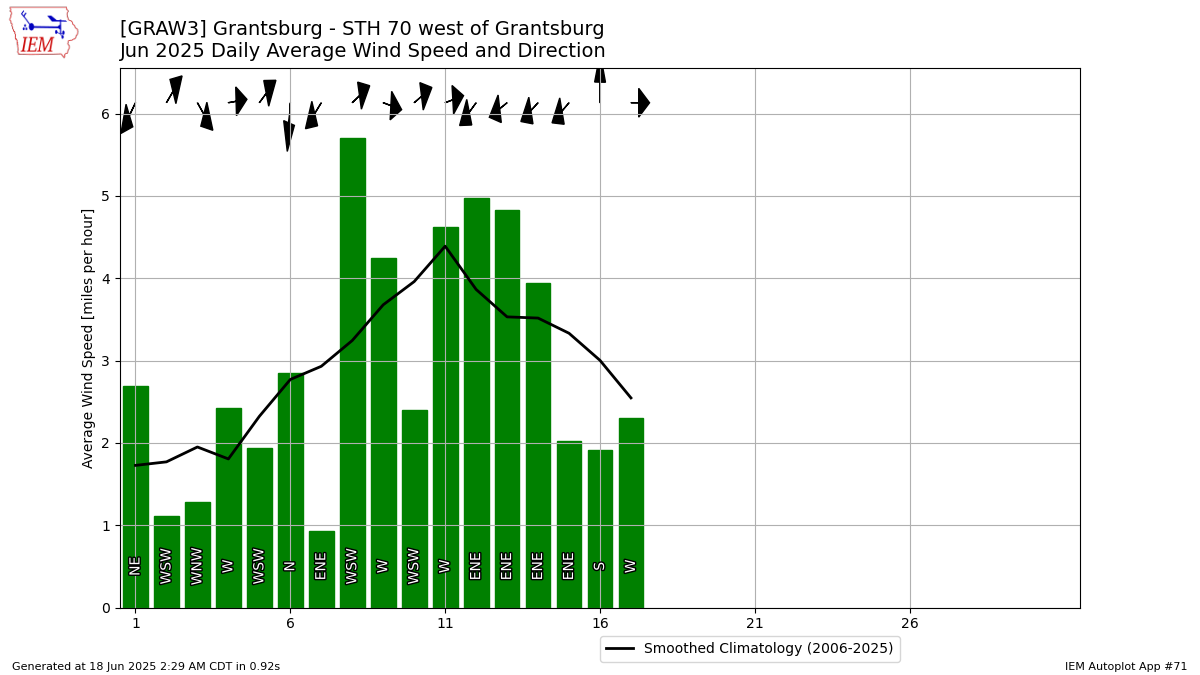
Description: This chart is of the daily average wind speeds.
The data presented here provided by IEM API webservice: daily.json. A simple CSV option exists as well.