| May 2025 | Jun 2025 | Jul 2025 | ||||
|---|---|---|---|---|---|---|
| Sunday | Monday | Tuesday | Wednesday | Thursday | Friday | Saturday |
| 01 High: 69.29061 Low: 38.55921 Precip: M Avg Wind: NE @ 2.8 RH% Min/Max: 26-88 Feel Min/Max: 39 to 69 | 02 High: 81.42078 Low: 48.19999 Precip: M Avg Wind: NE @ 6.4 RH% Min/Max: 30-70 Feel Min/Max: 46 to 80 | 03 High: 81.87978 Low: 60.58037 Precip: M Avg Wind: NE @ 8.9 RH% Min/Max: 53-93 Feel Min/Max: 61 to 83 | 04 High: 73.16961 Low: 56.809425 Precip: M Avg Wind: NE @ 3.8 RH% Min/Max: 46-96 Feel Min/Max: 57 to 73 | 05 High: 76.299774 Low: 51.459797 Precip: M Avg Wind: NE @ 2.9 RH% Min/Max: 31-91 Feel Min/Max: 51 to 76 | 06 High: 75.079414 Low: 55.000416 Precip: M Avg Wind: NE @ 4.2 RH% Min/Max: 29-84 Feel Min/Max: 55 to 75 | 07 High: 73.27041 Low: 55.439594 Precip: M Avg Wind: NE @ 4.7 RH% Min/Max: 33-81 Feel Min/Max: 56 to 73 |
| 08 High: 75.2792 Low: 52.019608 Precip: M Avg Wind: NE @ 5.4 RH% Min/Max: 52-90 Feel Min/Max: 52 to 75 | 09 High: 64.39999 Low: 55.099403 Precip: M Avg Wind: NE @ 8.6 RH% Min/Max: 55-84 Feel Min/Max: 55 to 64 | 10 High: 69.98 Low: 54.260597 Precip: M Avg Wind: NE @ 7.1 RH% Min/Max: 56-86 Feel Min/Max: 54 to 70 | 11 High: 85.11982 Low: 52.71081 Precip: M Avg Wind: NE @ 9.2 RH% Min/Max: 35-90 Feel Min/Max: 53 to 84 | 12 High: 70.12942 Low: 58.060383 Precip: M Avg Wind: NE @ 6.6 RH% Min/Max: 48-92 Feel Min/Max: 58 to 70 | 13 High: 66.34039 Low: 53.78 Precip: M Avg Wind: NE @ 8.5 RH% Min/Max: 55-82 Feel Min/Max: 54 to 66 | 14 High: 73.830215 Low: 51.279785 Precip: M Avg Wind: NE @ 5.1 RH% Min/Max: 57-90 Feel Min/Max: 51 to 74 |
| 15 High: 76.229576 Low: 55.310013 Precip: M Avg Wind: NE @ 4.0 RH% Min/Max: 58-91 Feel Min/Max: 55 to 74 | 16 High: 80.659424 Low: 58.6994 Precip: M Avg Wind: NE @ 3.1 RH% Min/Max: 55-82 Feel Min/Max: 59 to 82 | 17 High: 85.60042 Low: 64.909424 Precip: M Avg Wind: NE @ 6.2 RH% Min/Max: 50-86 Feel Min/Max: 65 to 89 | 18 High: 71.94018 Low: 64.09039 Precip: M RH% Min/Max: 78-95 Feel Min/Max: 64 to 72 | 19 Precip: M | 20 | 21 |
| 22 | 23 | 24 | 25 | 26 | 27 | 28 |
| 29 | 30 | 01 | 02 | 03 | 04 | 05 |
The data presented here provided by IEM API webservice: daily.json. A simple CSV option exists as well.
Daily High/Low Plot
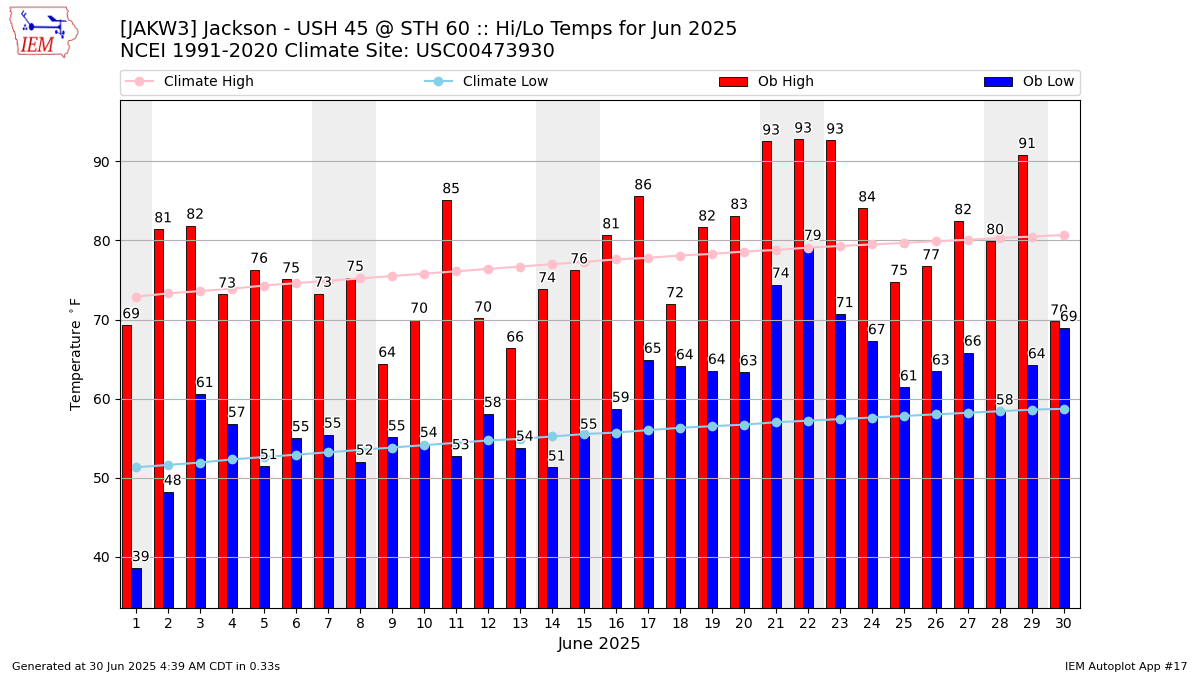
Description: This chart of the monthly temperature data. The bars are the observations and the dots are climatology.
Daily Rainfall
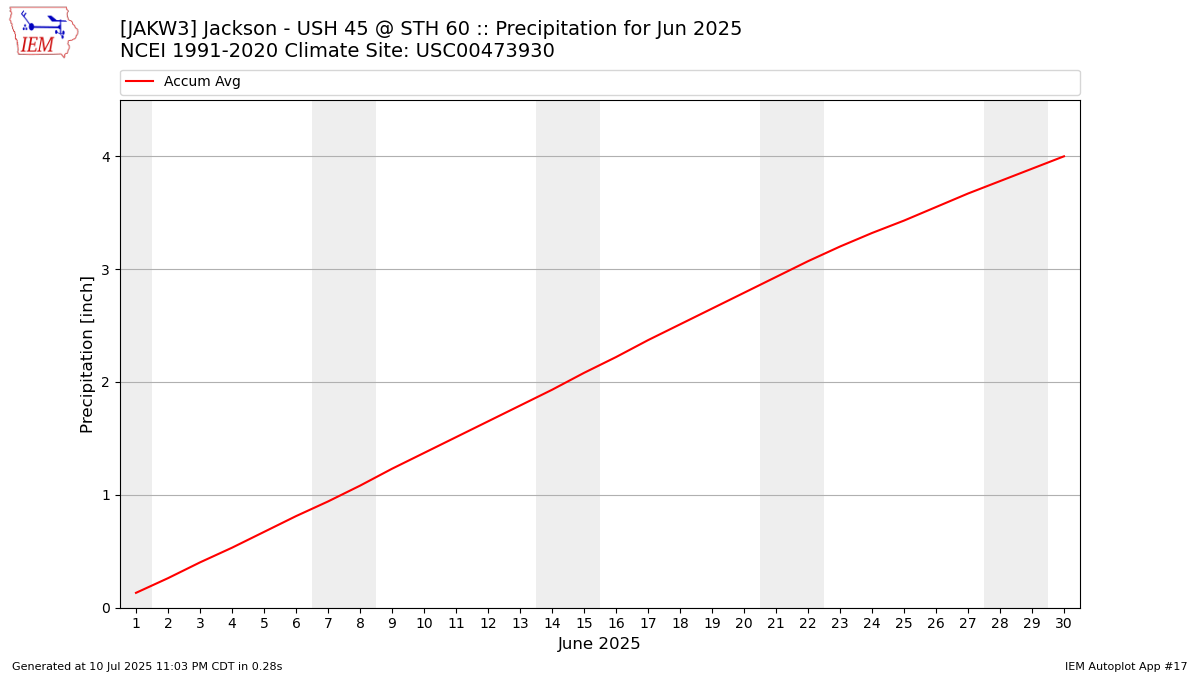
Description: This chart is of daily precipitation for the month. The red line would be an average month while the blue line and bars are observations.
Daily Average Wind Speeds
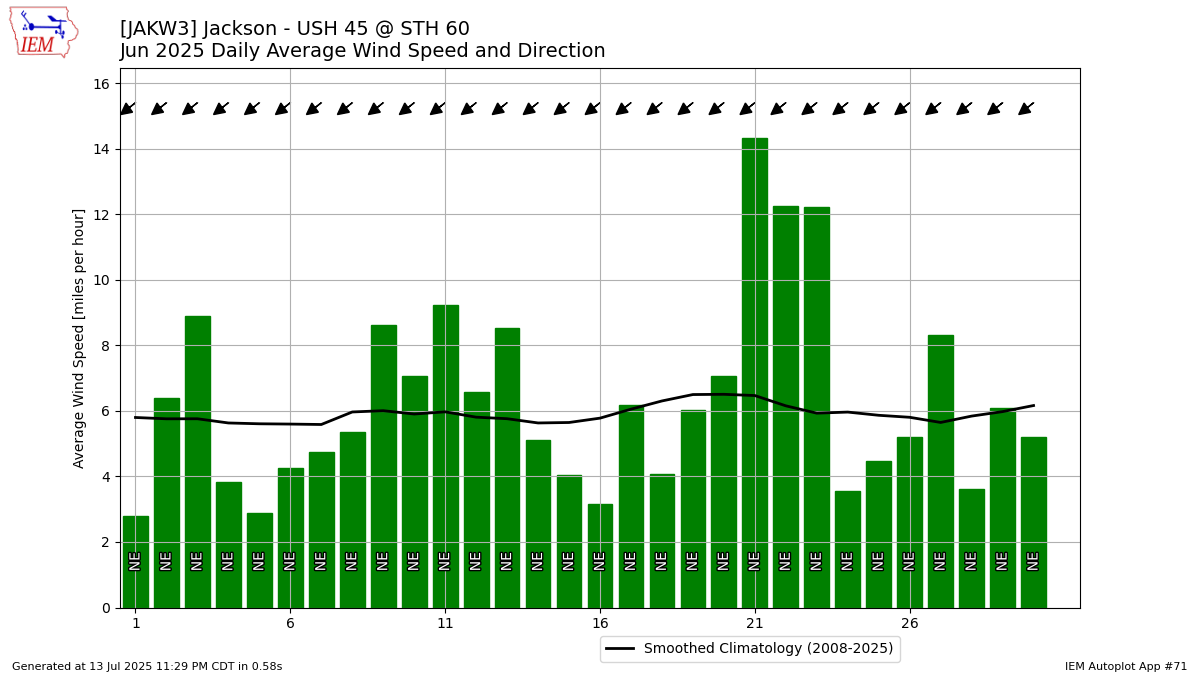
Description: This chart is of the daily average wind speeds.
The data presented here provided by IEM API webservice: daily.json. A simple CSV option exists as well.