| May 2025 | Jun 2025 | Jul 2025 | ||||
|---|---|---|---|---|---|---|
| Sunday | Monday | Tuesday | Wednesday | Thursday | Friday | Saturday |
| 01 High: 74.949776 Low: 49.46001 Precip: M Avg Wind: ESE @ 3.3 RH% Min/Max: 29-83 Feel Min/Max: 47 to 75 | 02 High: 83.960594 Low: 51.060226 Precip: M Avg Wind: SSE @ 7.8 RH% Min/Max: 42-81 Feel Min/Max: 51 to 84 | 03 High: 74.13981 Low: 56.22078 Precip: M Avg Wind: SSW @ 8.4 RH% Min/Max: 68-96 Feel Min/Max: 56 to 74 | 04 High: 76.51038 Low: 51.15921 Precip: M Avg Wind: NW @ 4.2 RH% Min/Max: 37-98 Feel Min/Max: 51 to 77 | 05 High: 76.6598 Low: 50.5292 Precip: M Avg Wind: ESE @ 2.5 RH% Min/Max: 32-90 Feel Min/Max: 51 to 77 | 06 High: 76.249405 Low: 56.87062 Precip: M Avg Wind: NNW @ 4.3 RH% Min/Max: 48-92 Feel Min/Max: 57 to 76 | 07 High: 75.11001 Low: 59.430214 Precip: M Avg Wind: ESE @ 4.4 RH% Min/Max: 43-83 Feel Min/Max: 59 to 75 |
| 08 High: 71.76918 Low: 56.569977 Precip: M Avg Wind: SW @ 7.0 RH% Min/Max: 39-93 Feel Min/Max: 57 to 72 | 09 High: 62.740395 Low: 52.16001 Precip: M Avg Wind: W @ 11.2 RH% Min/Max: 62-82 Feel Min/Max: 52 to 63 | 10 High: 75.88938 Low: 51.569607 Precip: M Avg Wind: W @ 8.0 RH% Min/Max: 51-89 Feel Min/Max: 52 to 76 | 11 High: 83.64919 Low: 63.249775 Precip: M Avg Wind: W @ 7.0 RH% Min/Max: 37-92 Feel Min/Max: 63 to 84 | 12 High: 76.409584 Low: 59.039597 Precip: M Avg Wind: ENE @ 6.2 RH% Min/Max: 63-96 Feel Min/Max: 59 to 76 | 13 High: 77.48058 Low: 56.24061 Precip: M Avg Wind: E @ 7.6 RH% Min/Max: 61-80 Feel Min/Max: 57 to 76 | 14 High: 79.14018 Low: 51.36982 Precip: M Avg Wind: ESE @ 6.7 RH% Min/Max: 62-93 Feel Min/Max: 51 to 79 |
| 15 High: 74.39002 Low: 64.07062 Precip: M Avg Wind: ESE @ 5.6 RH% Min/Max: 82-98 Feel Min/Max: 64 to 74 | 16 High: 78.220406 Low: 64.9292 Precip: M Avg Wind: SE @ 5.9 RH% Min/Max: 79-98 Feel Min/Max: 65 to 78 | 17 High: 78.339226 Low: 65.74999 Precip: M RH% Min/Max: 71-93 Feel Min/Max: 66 to 78 | 18 Precip: M | 19 | 20 | 21 |
| 22 | 23 | 24 | 25 | 26 | 27 | 28 |
| 29 | 30 | 01 | 02 | 03 | 04 | 05 |
The data presented here provided by IEM API webservice: daily.json. A simple CSV option exists as well.
Daily High/Low Plot
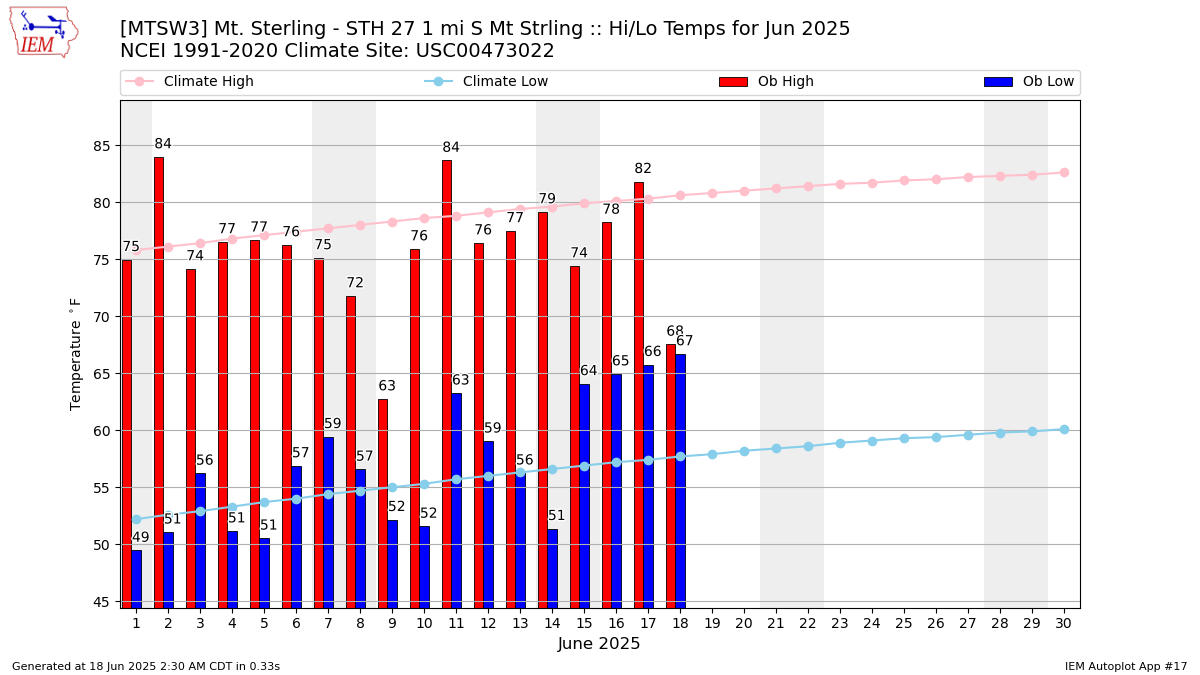
Description: This chart of the monthly temperature data. The bars are the observations and the dots are climatology.
Daily Rainfall
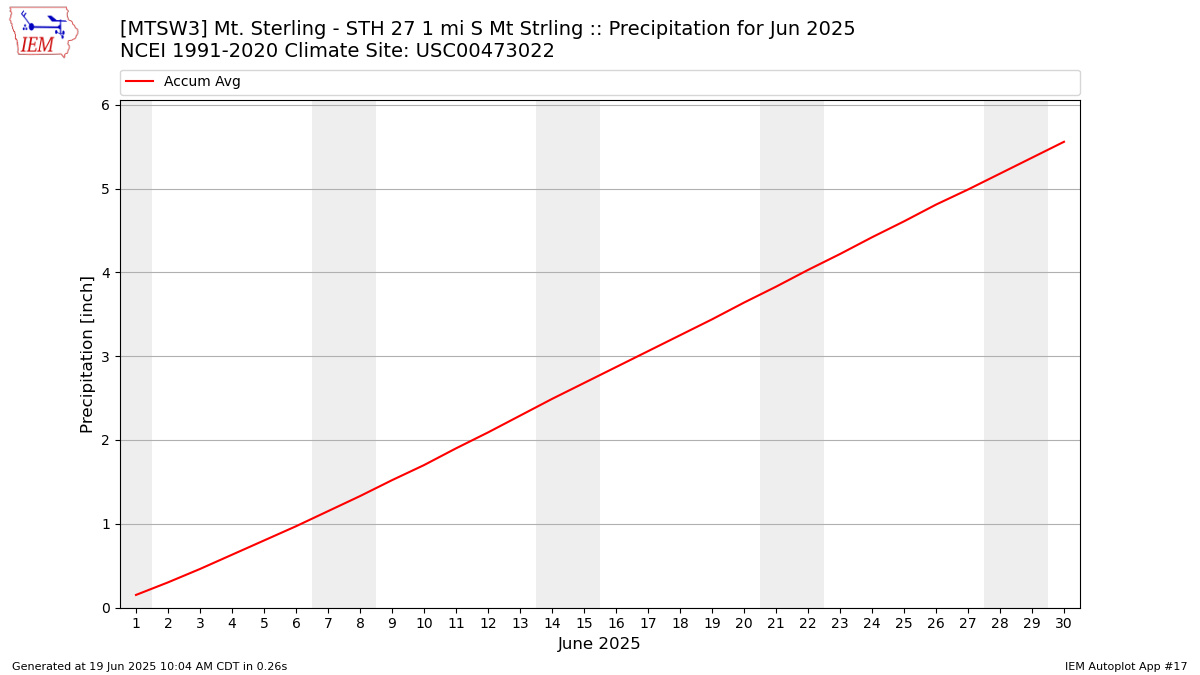
Description: This chart is of daily precipitation for the month. The red line would be an average month while the blue line and bars are observations.
Daily Average Wind Speeds
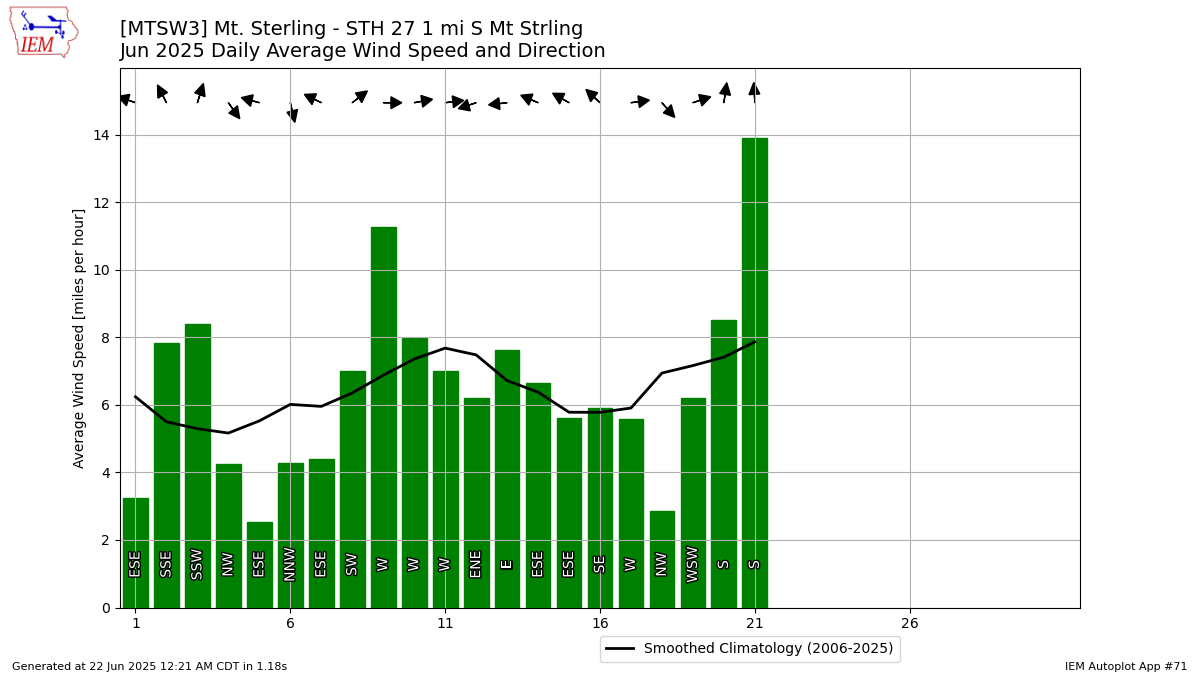
Description: This chart is of the daily average wind speeds.
The data presented here provided by IEM API webservice: daily.json. A simple CSV option exists as well.