| May 2025 | Jun 2025 | Jul 2025 | ||||
|---|---|---|---|---|---|---|
| Sunday | Monday | Tuesday | Wednesday | Thursday | Friday | Saturday |
| 01 High: 77.95937 Low: 50.34018 Precip: M Avg Wind: SSE @ 1.3 RH% Min/Max: 28-97 Feel Min/Max: 50 to 78 | 02 High: 87.4292 Low: 54.109425 Precip: M Avg Wind: S @ 5.3 RH% Min/Max: 37-86 Feel Min/Max: 54 to 87 | 03 High: 77.26998 Low: 59.63 Precip: M Avg Wind: SSE @ 6.2 RH% Min/Max: 62-95 Feel Min/Max: 60 to 77 | 04 High: 77.12062 Low: 55.479202 Precip: M Avg Wind: NNE @ 3.4 RH% Min/Max: 38-95 Feel Min/Max: 55 to 77 | 05 High: 80.88981 Low: 52.840393 Precip: M Avg Wind: WNW @ 2.0 RH% Min/Max: 28-94 Feel Min/Max: 53 to 80 | 06 High: 77.50042 Low: 61.620777 Precip: M Avg Wind: N @ 4.6 RH% Min/Max: 46-86 Feel Min/Max: 62 to 77 | 07 High: 78.90079 Low: 63.809586 Precip: M Avg Wind: S @ 2.5 RH% Min/Max: 36-84 Feel Min/Max: 64 to 79 |
| 08 High: 75.919975 Low: 61.440823 Precip: M Avg Wind: E @ 4.2 RH% Min/Max: 31-91 Feel Min/Max: 61 to 75 | 09 High: 67.47078 Low: 56.629414 Precip: M Avg Wind: NE @ 5.9 RH% Min/Max: 51-72 Feel Min/Max: 57 to 67 | 10 High: 81.60079 Low: 53.49919 Precip: M Avg Wind: ENE @ 3.0 RH% Min/Max: 37-82 Feel Min/Max: 53 to 81 | 11 High: 86.9792 Low: 64.9292 Precip: M Avg Wind: N @ 3.7 RH% Min/Max: 29-92 Feel Min/Max: 65 to 87 | 12 High: 81.12019 Low: 62.40921 Precip: M Avg Wind: WNW @ 4.2 RH% Min/Max: 59-98 Feel Min/Max: 62 to 83 | 13 High: 80.729576 Low: 60.830585 Precip: M Avg Wind: W @ 3.9 RH% Min/Max: 57-71 Feel Min/Max: 61 to 83 | 14 High: 83.87062 Low: 56.429573 Precip: M Avg Wind: SSW @ 3.3 RH% Min/Max: 52-84 Feel Min/Max: 56 to 86 |
| 15 High: 76.92078 Low: 67.74978 Precip: M Avg Wind: SSW @ 2.2 RH% Min/Max: 68-96 Feel Min/Max: 68 to 77 | 16 High: 79.689224 Low: 68.28981 Precip: M RH% Min/Max: 77-93 Feel Min/Max: 68 to 80 | 17 Precip: M | 18 | 19 | 20 | 21 |
| 22 | 23 | 24 | 25 | 26 | 27 | 28 |
| 29 | 30 | 01 | 02 | 03 | 04 | 05 |
The data presented here provided by IEM API webservice: daily.json. A simple CSV option exists as well.
Daily High/Low Plot
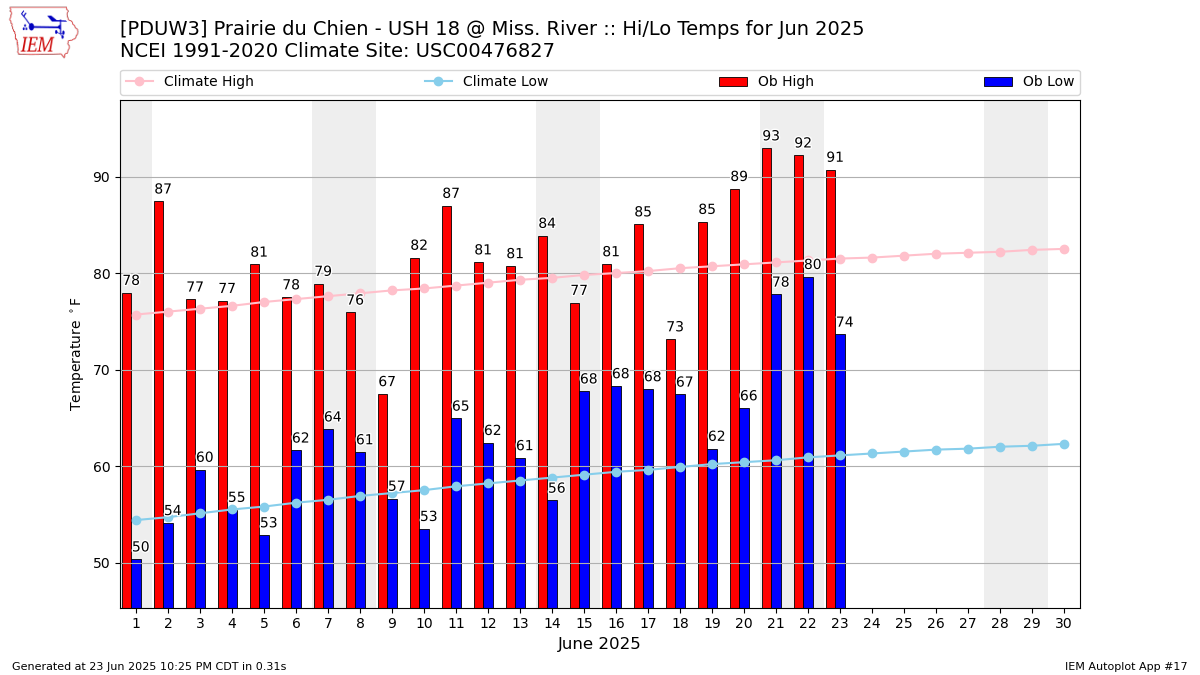
Description: This chart of the monthly temperature data. The bars are the observations and the dots are climatology.
Daily Rainfall
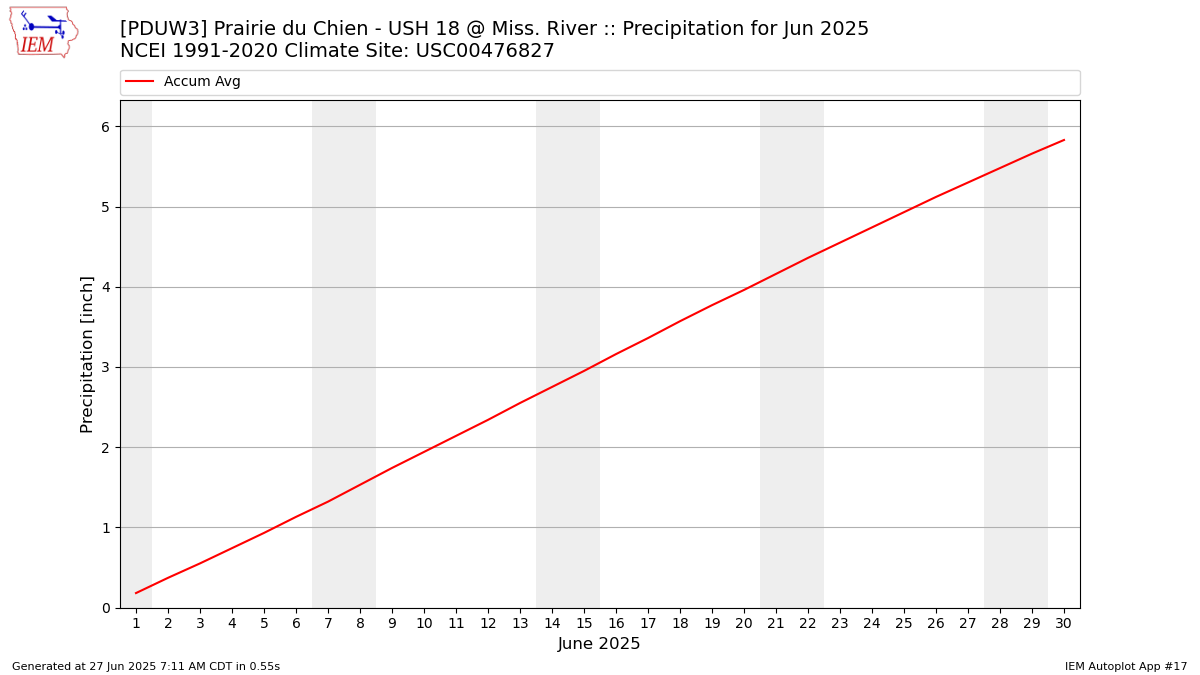
Description: This chart is of daily precipitation for the month. The red line would be an average month while the blue line and bars are observations.
Daily Average Wind Speeds
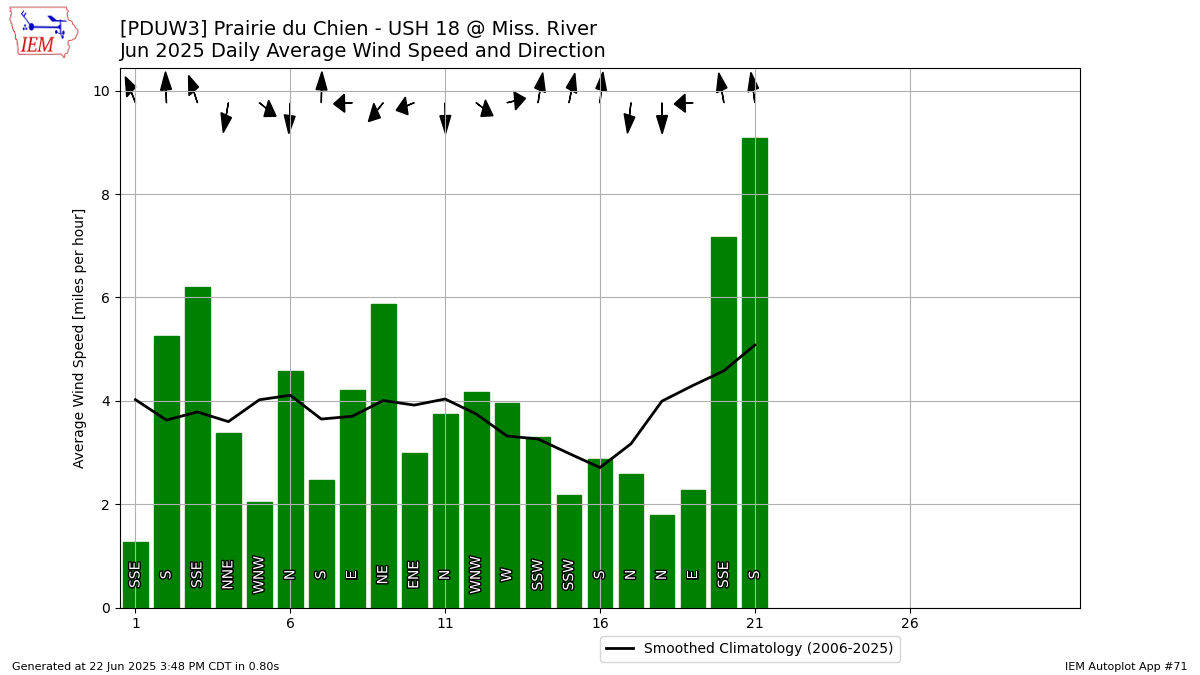
Description: This chart is of the daily average wind speeds.
The data presented here provided by IEM API webservice: daily.json. A simple CSV option exists as well.