| May 2025 | Jun 2025 | Jul 2025 | ||||
|---|---|---|---|---|---|---|
| Sunday | Monday | Tuesday | Wednesday | Thursday | Friday | Saturday |
| 01 High: 74.35042 Low: 34.9106 Precip: M Avg Wind: WSW @ 0.9 RH% Min/Max: 0-63 Feel Min/Max: 35 to 74 | 02 High: 81.710594 Low: 43.469604 Precip: M Avg Wind: SSW @ 5.3 RH% Min/Max: 10-63 Feel Min/Max: 43 to 80 | 03 High: 75.63922 Low: 52.890823 Precip: M Avg Wind: SW @ 5.3 RH% Min/Max: 30-62 Feel Min/Max: 53 to 76 | 04 High: 75.329575 Low: 47.229786 Precip: M Avg Wind: NNW @ 1.6 RH% Min/Max: 0-62 Feel Min/Max: 47 to 75 | 05 High: 79.06998 Low: 42.679413 Precip: M Avg Wind: NNE @ 0.8 RH% Min/Max: 2-63 Feel Min/Max: 43 to 79 | 06 High: 73.25958 Low: 54.750202 Precip: M Avg Wind: NNW @ 2.3 RH% Min/Max: 15-60 Feel Min/Max: 55 to 73 | 07 High: 72.37942 Low: 53.51001 Precip: M Avg Wind: E @ 2.6 RH% Min/Max: 19-62 Feel Min/Max: 54 to 72 |
| 08 High: 69.229416 Low: 49.99999 Precip: M Avg Wind: SW @ 5.4 RH% Min/Max: 10-62 Feel Min/Max: 49 to 69 | 09 High: 60.81081 Low: 48.0308 Precip: M Avg Wind: WSW @ 5.5 RH% Min/Max: 30-62 Feel Min/Max: 43 to 61 | 10 High: 69.20058 Low: 52.449776 Precip: M Avg Wind: W @ 4.3 RH% Min/Max: 22-60 Feel Min/Max: 52 to 69 | 11 High: 77.64983 Low: 48.459213 Precip: M Avg Wind: NW @ 3.0 RH% Min/Max: 10-64 Feel Min/Max: 48 to 78 | 12 High: 69.26001 Low: 52.519978 Precip: M Avg Wind: ENE @ 5.5 RH% Min/Max: 20-60 Feel Min/Max: 53 to 69 | 13 High: 52.77019 Low: 48.720192 Precip: M Avg Wind: ENE @ 9.0 RH% Min/Max: 44-62 Feel Min/Max: 45 to 53 | 14 High: 68.91982 Low: 48.950577 Precip: M Avg Wind: ENE @ 5.7 RH% Min/Max: 34-61 Feel Min/Max: 44 to 69 |
| 15 High: 68.97019 Low: 51.999775 Precip: M RH% Min/Max: 37-60 Feel Min/Max: 52 to 69 | 16 Precip: M | 17 | 18 | 19 | 20 | 21 |
| 22 | 23 | 24 | 25 | 26 | 27 | 28 |
| 29 | 30 | 01 | 02 | 03 | 04 | 05 |
The data presented here provided by IEM API webservice: daily.json. A simple CSV option exists as well.
Daily High/Low Plot
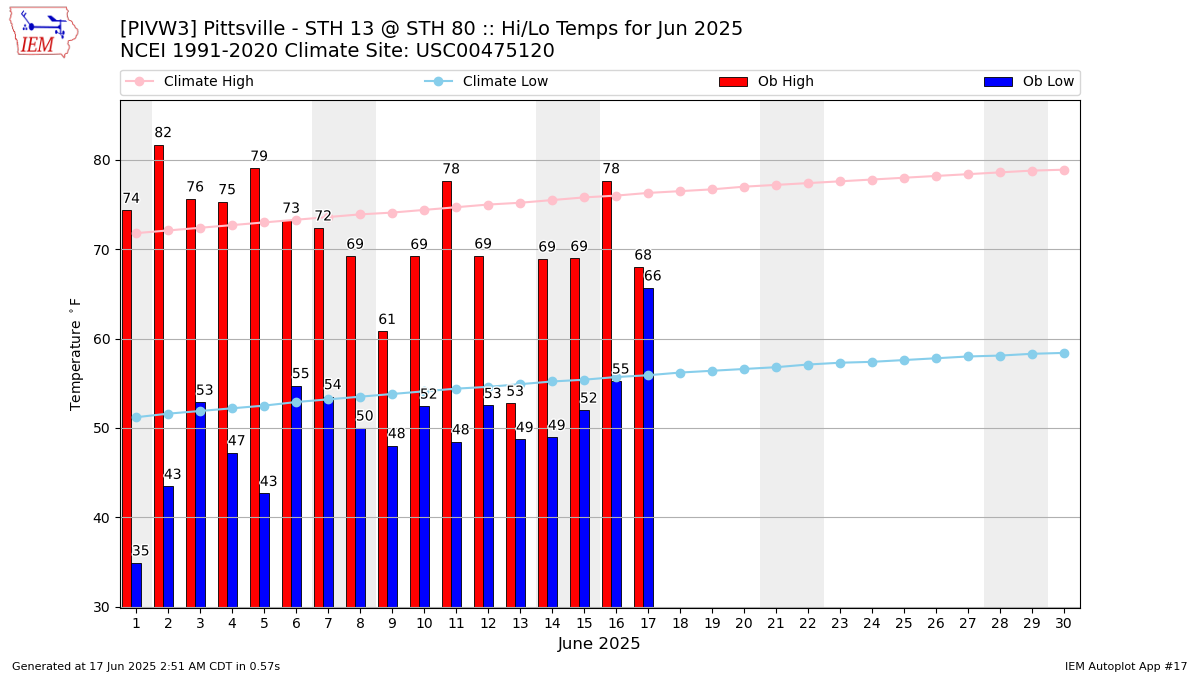
Description: This chart of the monthly temperature data. The bars are the observations and the dots are climatology.
Daily Rainfall
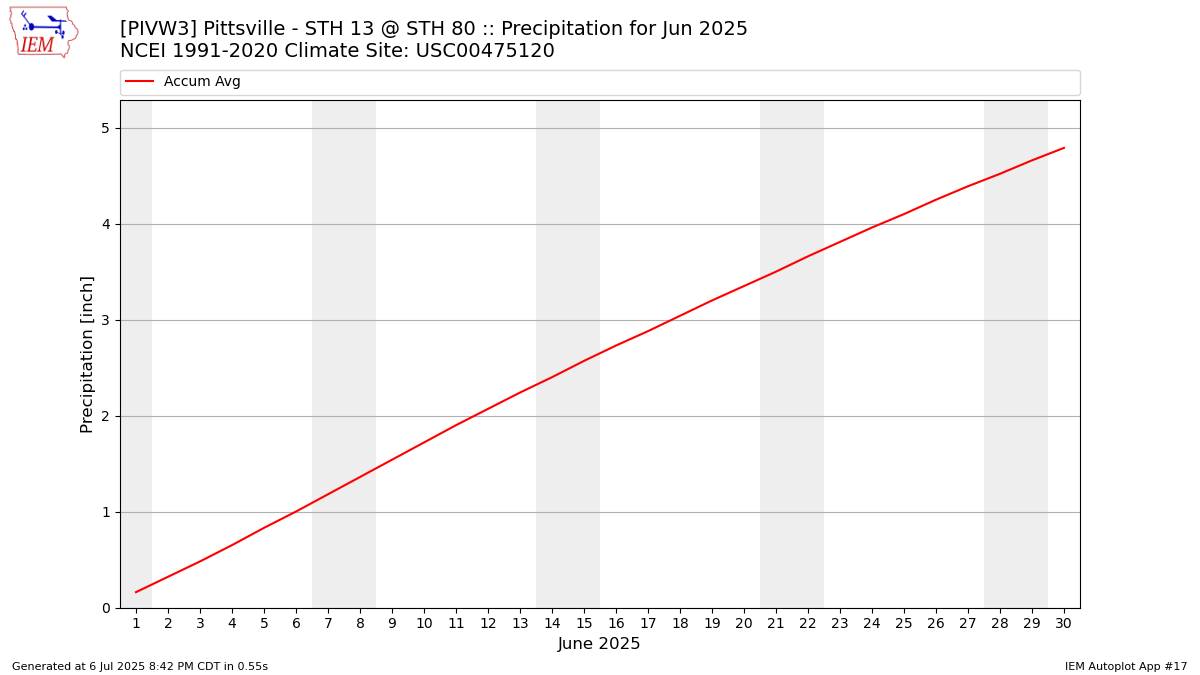
Description: This chart is of daily precipitation for the month. The red line would be an average month while the blue line and bars are observations.
Daily Average Wind Speeds
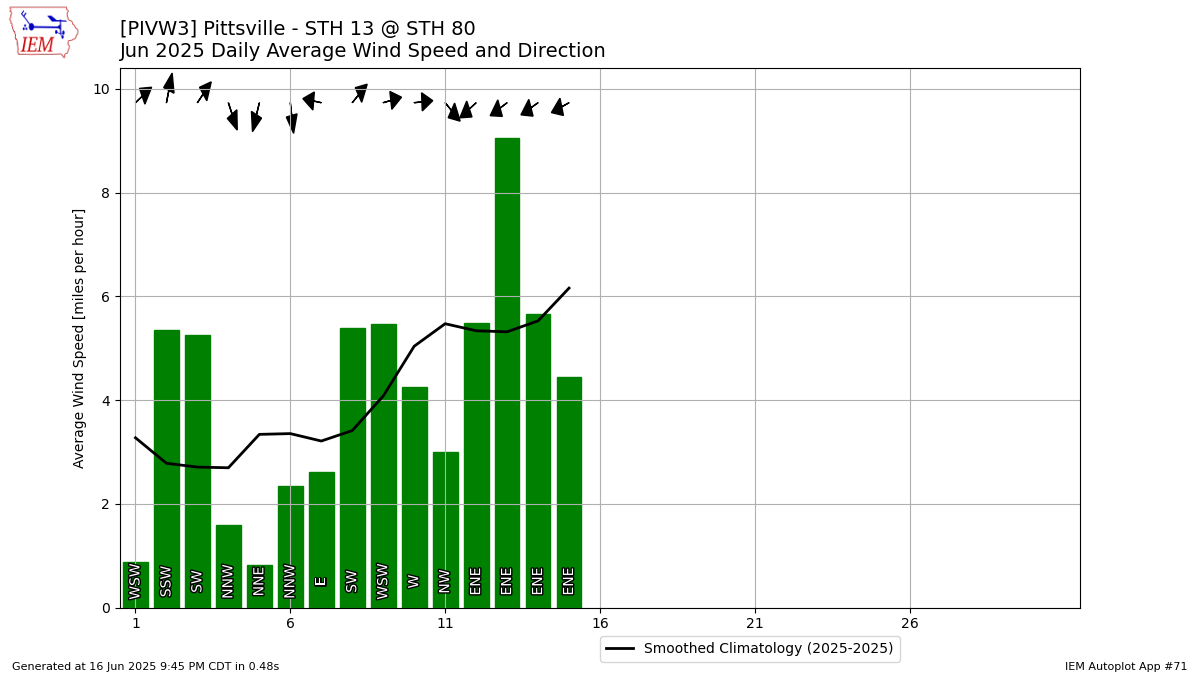
Description: This chart is of the daily average wind speeds.
The data presented here provided by IEM API webservice: daily.json. A simple CSV option exists as well.