| May 2025 | Jun 2025 | Jul 2025 | ||||
|---|---|---|---|---|---|---|
| Sunday | Monday | Tuesday | Wednesday | Thursday | Friday | Saturday |
| 01 High: 75.48981 Low: 40.620193 Precip: M Avg Wind: WSW @ 1.2 RH% Min/Max: 27-91 Feel Min/Max: 41 to 75 | 02 High: 84.329575 Low: 51.54082 Precip: M Avg Wind: S @ 6.3 RH% Min/Max: 41-83 Feel Min/Max: 52 to 84 | 03 High: 76.049614 Low: 56.08037 Precip: M Avg Wind: ESE @ 7.0 RH% Min/Max: 58-94 Feel Min/Max: 56 to 76 | 04 High: 76.029785 Low: 52.59018 Precip: M Avg Wind: NE @ 2.9 RH% Min/Max: 26-95 Feel Min/Max: 53 to 75 | 05 High: 78.339226 Low: 46.270405 Precip: M Avg Wind: W @ 1.3 RH% Min/Max: 29-94 Feel Min/Max: 47 to 78 | 06 High: 71.18059 Low: 57.4808 Precip: M Avg Wind: NNE @ 2.6 RH% Min/Max: 47-92 Feel Min/Max: 57 to 71 | 07 High: 74.89941 Low: 54.039223 Precip: M Avg Wind: W @ 1.8 RH% Min/Max: 45-94 Feel Min/Max: 54 to 75 |
| 08 High: 73.610596 Low: 55.540394 Precip: M Avg Wind: ESE @ 6.0 RH% Min/Max: 33-93 Feel Min/Max: 56 to 74 | 09 High: 62.16982 Low: 50.579628 Precip: M Avg Wind: E @ 6.5 RH% Min/Max: 65-90 Feel Min/Max: 51 to 62 | 10 High: 73.86081 Low: 55.900417 Precip: M Avg Wind: E @ 5.4 RH% Min/Max: 51-90 Feel Min/Max: 56 to 74 | 11 High: 79.91961 Low: 61.120407 Precip: M Avg Wind: ENE @ 5.1 RH% Min/Max: 35-86 Feel Min/Max: 63 to 80 | 12 High: 71.259796 Low: 58.780373 Precip: M Avg Wind: W @ 5.8 RH% Min/Max: 51-92 Feel Min/Max: 59 to 71 | 13 High: 64.889595 Low: 53.229202 Precip: M Avg Wind: W @ 7.5 RH% Min/Max: 56-85 Feel Min/Max: 53 to 65 | 14 High: 78.499405 Low: 52.43 Precip: M Avg Wind: W @ 5.4 RH% Min/Max: 58-89 Feel Min/Max: 52 to 78 |
| 15 High: 74.49082 Low: 57.599617 Precip: M Avg Wind: WSW @ 3.7 RH% Min/Max: 72-93 Feel Min/Max: 58 to 74 | 16 High: 63.96982 Low: 61.8098 Precip: M RH% Min/Max: 93-96 Feel Min/Max: 62 to 64 | 17 Precip: M | 18 | 19 | 20 | 21 |
| 22 | 23 | 24 | 25 | 26 | 27 | 28 |
| 29 | 30 | 01 | 02 | 03 | 04 | 05 |
The data presented here provided by IEM API webservice: daily.json. A simple CSV option exists as well.
Daily High/Low Plot
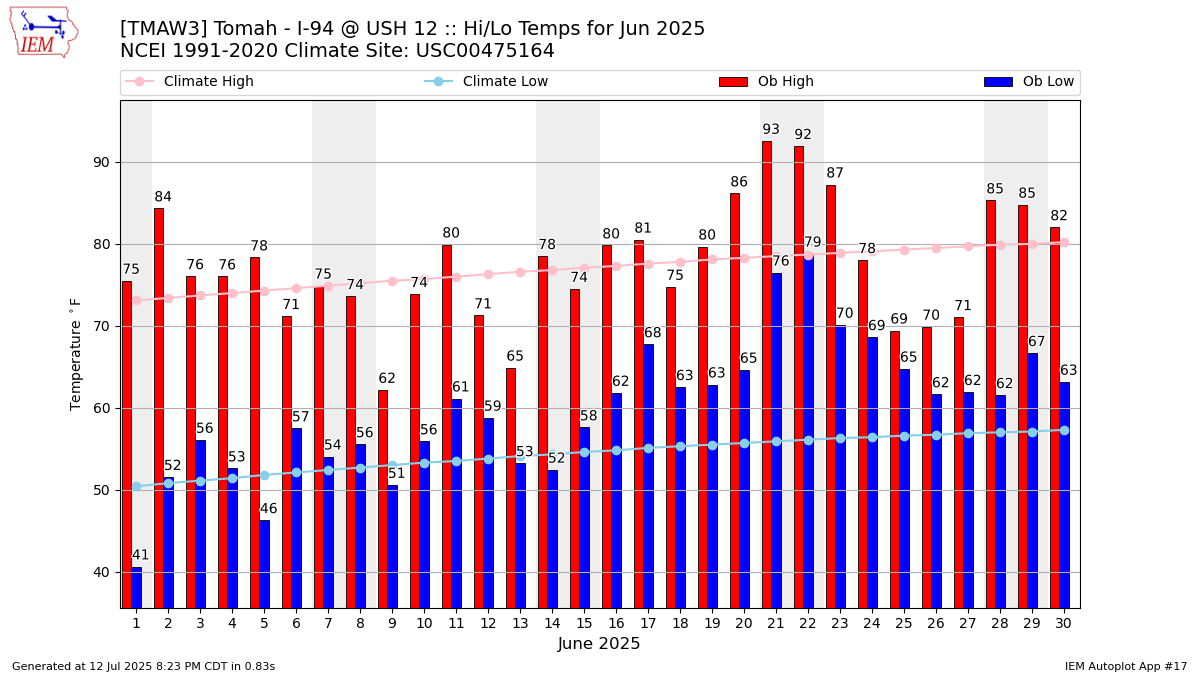
Description: This chart of the monthly temperature data. The bars are the observations and the dots are climatology.
Daily Rainfall
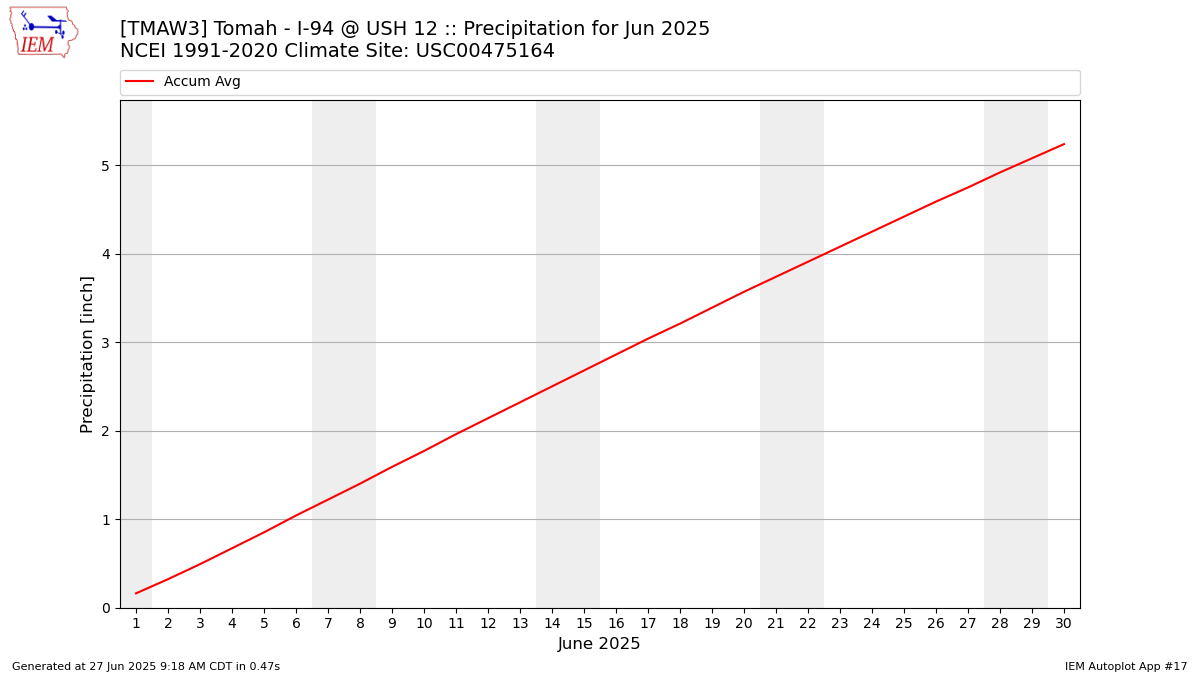
Description: This chart is of daily precipitation for the month. The red line would be an average month while the blue line and bars are observations.
Daily Average Wind Speeds

Description: This chart is of the daily average wind speeds.
The data presented here provided by IEM API webservice: daily.json. A simple CSV option exists as well.