| May 2025 | Jun 2025 | Jul 2025 | ||||
|---|---|---|---|---|---|---|
| Sunday | Monday | Tuesday | Wednesday | Thursday | Friday | Saturday |
| 01 High: 74.98938 Low: 32.739807 Precip: M Avg Wind: ESE @ 3.0 RH% Min/Max: 24-95 Feel Min/Max: 33 to 75 | 02 High: 84.61939 Low: 49.589596 Precip: M Avg Wind: E @ 3.9 RH% Min/Max: 35-84 Feel Min/Max: 50 to 83 | 03 High: 72.87078 Low: 51.319393 Precip: M Avg Wind: E @ 4.3 RH% Min/Max: 60-99 Feel Min/Max: 51 to 73 | 04 High: 72.46038 Low: 48.720192 Precip: M Avg Wind: SE @ 3.4 RH% Min/Max: 29-100 Feel Min/Max: 49 to 72 | 05 High: 76.2098 Low: 41.41939 Precip: M Avg Wind: E @ 2.8 RH% Min/Max: 27-100 Feel Min/Max: 41 to 76 | 06 High: 67.44018 Low: 53.33 Precip: M Avg Wind: NE @ 3.4 RH% Min/Max: 44-88 Feel Min/Max: 53 to 67 | 07 High: 75.070404 Low: 52.460598 Precip: M Avg Wind: E @ 4.3 RH% Min/Max: 39-90 Feel Min/Max: 53 to 75 |
| 08 High: 68.91982 Low: 53.630585 Precip: M Avg Wind: ESE @ 4.8 RH% Min/Max: 42-97 Feel Min/Max: 54 to 69 | 09 High: 61.840393 Low: 49.710224 Precip: M Avg Wind: SE @ 4.2 RH% Min/Max: 60-96 Feel Min/Max: 47 to 62 | 10 High: 63.159798 Low: 49.33037 Precip: M Avg Wind: SE @ 4.0 RH% Min/Max: 72-98 Feel Min/Max: 49 to 63 | 11 High: 70.80079 Low: 45.51982 Precip: M Avg Wind: ESE @ 5.2 RH% Min/Max: 43-100 Feel Min/Max: 46 to 71 | 12 High: 69.76038 Low: 44.060013 Precip: M Avg Wind: NE @ 3.6 RH% Min/Max: 37-99 Feel Min/Max: 44 to 70 | 13 High: 54.140022 Low: 45.260597 Precip: M Avg Wind: NE @ 4.6 RH% Min/Max: 63-97 Feel Min/Max: 42 to 54 | 14 High: 54.39919 Low: 48.290024 Precip: M RH% Min/Max: 94-99 Feel Min/Max: 45 to 54 |
| 15 Precip: M | 16 | 17 | 18 | 19 | 20 | 21 |
| 22 | 23 | 24 | 25 | 26 | 27 | 28 |
| 29 | 30 | 01 | 02 | 03 | 04 | 05 |
The data presented here provided by IEM API webservice: daily.json. A simple CSV option exists as well.
Daily High/Low Plot
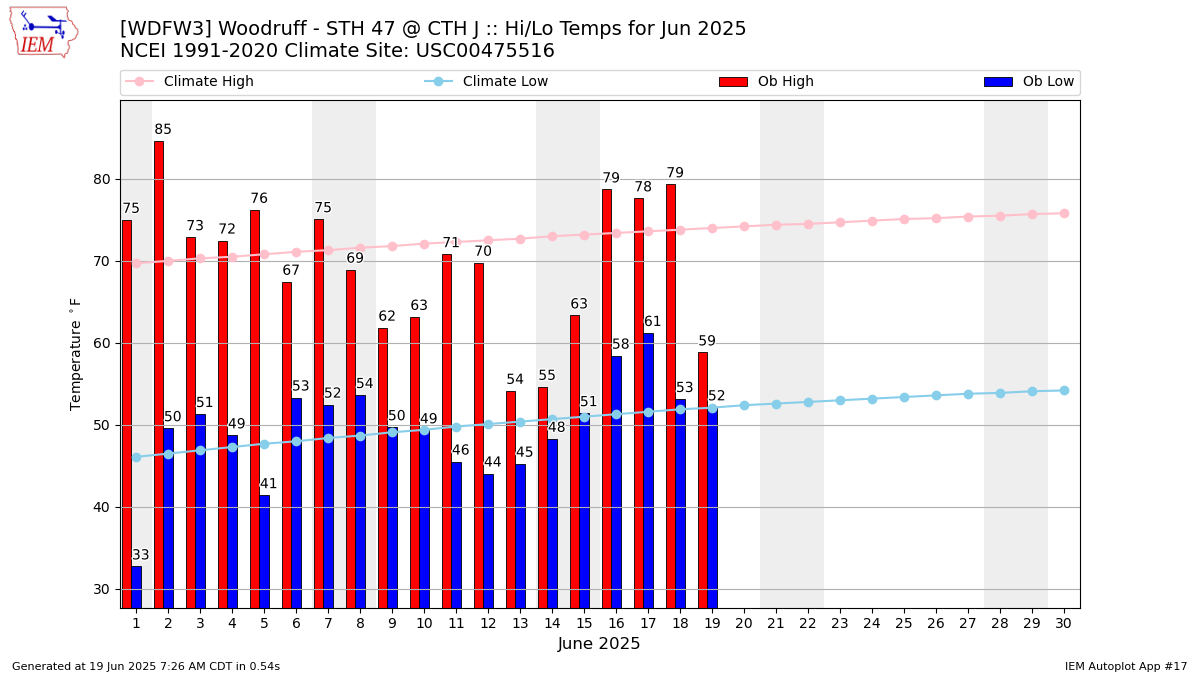
Description: This chart of the monthly temperature data. The bars are the observations and the dots are climatology.
Daily Rainfall

Description: This chart is of daily precipitation for the month. The red line would be an average month while the blue line and bars are observations.
Daily Average Wind Speeds
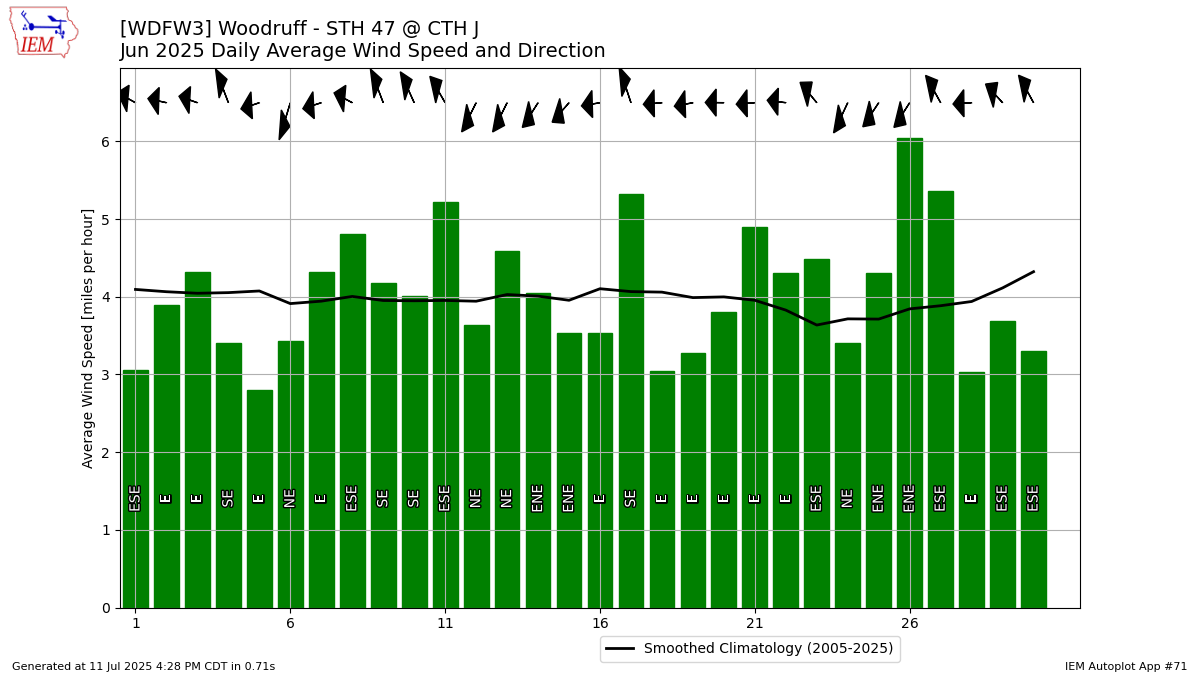
Description: This chart is of the daily average wind speeds.
The data presented here provided by IEM API webservice: daily.json. A simple CSV option exists as well.