| May 2025 | Jun 2025 | Jul 2025 | ||||
|---|---|---|---|---|---|---|
| Sunday | Monday | Tuesday | Wednesday | Thursday | Friday | Saturday |
| 01 High: 80.70079 Low: 47.93 Precip: M Avg Wind: N @ 0.0 RH% Min/Max: 34-78 Feel Min/Max: 48 to 80 | 02 High: 90.5396 Low: 62.839382 Precip: M Avg Wind: N @ 0.0 RH% Min/Max: 31-91 Feel Min/Max: 63 to 89 | 03 High: 71.4002 Low: 54.100418 Precip: M Avg Wind: N @ 0.0 RH% Min/Max: 73-97 Feel Min/Max: 54 to 71 | 04 High: 76.85958 Low: 47.170406 Precip: M Avg Wind: N @ 0.0 RH% Min/Max: 23-100 Feel Min/Max: 47 to 77 | 05 High: 78.389595 Low: 47.569977 Precip: M Avg Wind: N @ 0.0 RH% Min/Max: 30-96 Feel Min/Max: 48 to 78 | 06 High: 72.10943 Low: 57.560013 Precip: M Avg Wind: N @ 0.0 RH% Min/Max: 50-90 Feel Min/Max: 58 to 72 | 07 High: 74.01022 Low: 53.189594 Precip: M Avg Wind: N @ 0.0 RH% Min/Max: 54-98 Feel Min/Max: 53 to 74 |
| 08 High: 70.86918 Low: 53.979786 Precip: M Avg Wind: N @ 0.0 RH% Min/Max: 40-95 Feel Min/Max: 54 to 71 | 09 High: 65.1704 Low: 49.73 Precip: M Avg Wind: N @ 0.0 RH% Min/Max: 58-94 Feel Min/Max: 50 to 65 | 10 High: 80.09061 Low: 56.76982 Precip: M Avg Wind: N @ 0.0 RH% Min/Max: 39-80 Feel Min/Max: 57 to 80 | 11 High: 72.87078 Low: 55.040024 Precip: M Avg Wind: N @ 0.0 RH% Min/Max: 48-96 Feel Min/Max: 55 to 73 | 12 High: 69.119606 Low: 51.92062 Precip: M Avg Wind: N @ 0.0 RH% Min/Max: 57-97 Feel Min/Max: 52 to 69 | 13 High: 57.729202 Low: 50.79919 Precip: M Avg Wind: N @ 0.0 RH% Min/Max: 86-95 Feel Min/Max: 51 to 58 | 14 High: 61.309425 Low: 52.519978 Precip: M Avg Wind: N @ 0.0 RH% Min/Max: 86-97 Feel Min/Max: 53 to 61 |
| 15 High: 59.309586 Low: 57.399776 Precip: M RH% Min/Max: 90-94 Feel Min/Max: 57 to 59 | 16 Precip: M | 17 | 18 | 19 | 20 | 21 |
| 22 | 23 | 24 | 25 | 26 | 27 | 28 |
| 29 | 30 | 01 | 02 | 03 | 04 | 05 |
The data presented here provided by IEM API webservice: daily.json. A simple CSV option exists as well.
Daily High/Low Plot
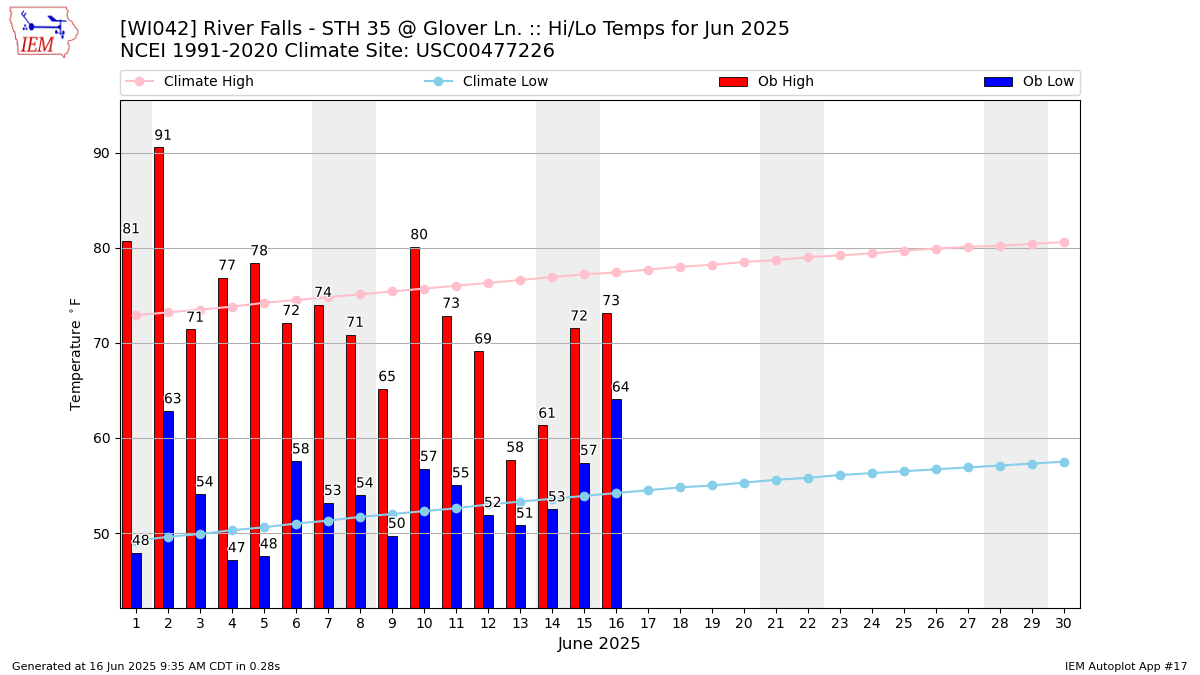
Description: This chart of the monthly temperature data. The bars are the observations and the dots are climatology.
Daily Rainfall
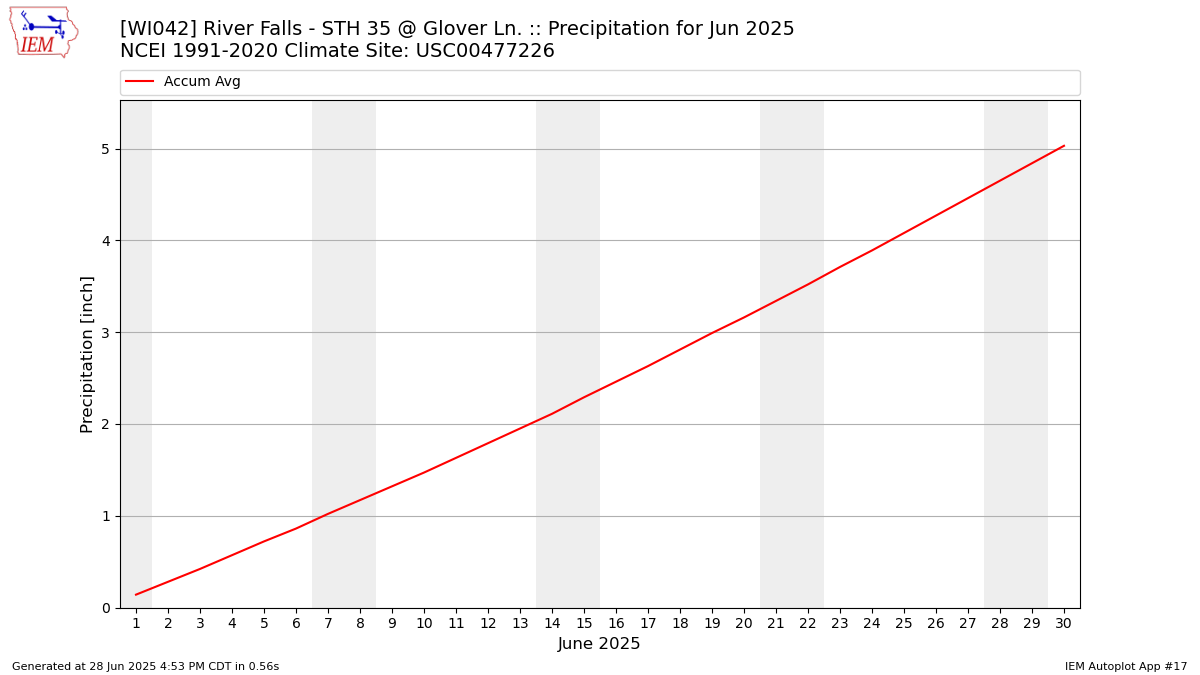
Description: This chart is of daily precipitation for the month. The red line would be an average month while the blue line and bars are observations.
Daily Average Wind Speeds
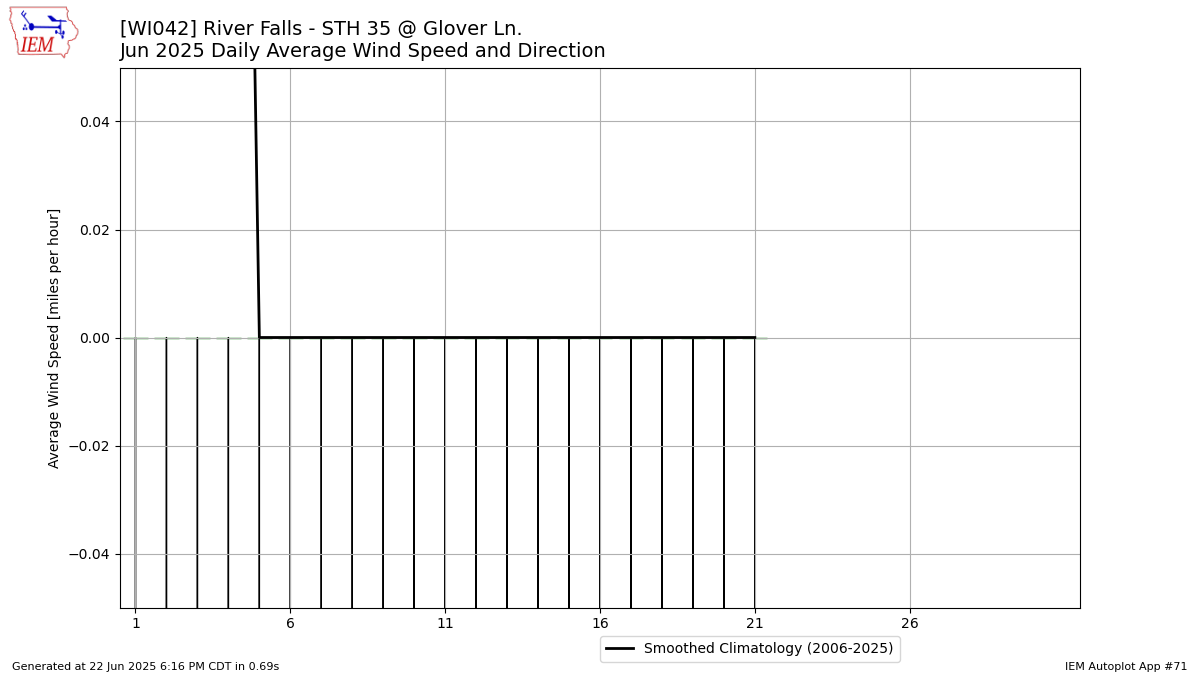
Description: This chart is of the daily average wind speeds.
The data presented here provided by IEM API webservice: daily.json. A simple CSV option exists as well.