| May 2025 | Jun 2025 | Jul 2025 | ||||
|---|---|---|---|---|---|---|
| Sunday | Monday | Tuesday | Wednesday | Thursday | Friday | Saturday |
| 01 High: 79.14919 Low: 34.660385 Precip: M Avg Wind: SSE @ 1.9 RH% Min/Max: 27-94 Feel Min/Max: 33 to 79 | 02 High: 88.73058 Low: 49.920776 Precip: M Avg Wind: WSW @ 3.0 RH% Min/Max: 33-94 Feel Min/Max: 50 to 87 | 03 High: 66.46998 Low: 52.829628 Precip: M Avg Wind: WNW @ 1.7 RH% Min/Max: 77-96 Feel Min/Max: 53 to 66 | 04 High: 75.03981 Low: 44.009583 Precip: M Avg Wind: WNW @ 2.8 RH% Min/Max: 27-99 Feel Min/Max: 42 to 75 | 05 High: 77.10079 Low: 41.28981 Precip: M Avg Wind: W @ 1.8 RH% Min/Max: 28-96 Feel Min/Max: 39 to 77 | 06 High: 60.4292 Low: 52.419178 Precip: M Avg Wind: NE @ 1.9 RH% Min/Max: 71-94 Feel Min/Max: 52 to 60 | 07 High: 75.189224 Low: 51.099777 Precip: M Avg Wind: SSE @ 1.6 RH% Min/Max: 48-96 Feel Min/Max: 51 to 75 |
| 08 High: 66.61939 Low: 50.939594 Precip: M Avg Wind: W @ 3.2 RH% Min/Max: 52-97 Feel Min/Max: 51 to 67 | 09 High: 65.74999 Low: 50.149403 Precip: M Avg Wind: WNW @ 5.9 RH% Min/Max: 54-97 Feel Min/Max: 50 to 66 | 10 High: 71.9204 Low: 52.239223 Precip: M Avg Wind: WNW @ 5.2 RH% Min/Max: 54-94 Feel Min/Max: 52 to 72 | 11 High: 71.20937 Low: 48.340393 Precip: M Avg Wind: WNW @ 3.1 RH% Min/Max: 42-98 Feel Min/Max: 47 to 71 | 12 High: 60.400417 Low: 43.680214 Precip: M Avg Wind: ESE @ 3.7 RH% Min/Max: 60-95 Feel Min/Max: 42 to 60 | 13 High: 53.850204 Low: 48.009212 Precip: M Avg Wind: E @ 4.4 RH% Min/Max: 68-92 Feel Min/Max: 45 to 54 | 14 High: 57.189224 Low: 48.390823 Precip: M RH% Min/Max: 78-86 Feel Min/Max: 45 to 57 |
| 15 Precip: M | 16 | 17 | 18 | 19 | 20 | 21 |
| 22 | 23 | 24 | 25 | 26 | 27 | 28 |
| 29 | 30 | 01 | 02 | 03 | 04 | 05 |
The data presented here provided by IEM API webservice: daily.json. A simple CSV option exists as well.
Daily High/Low Plot
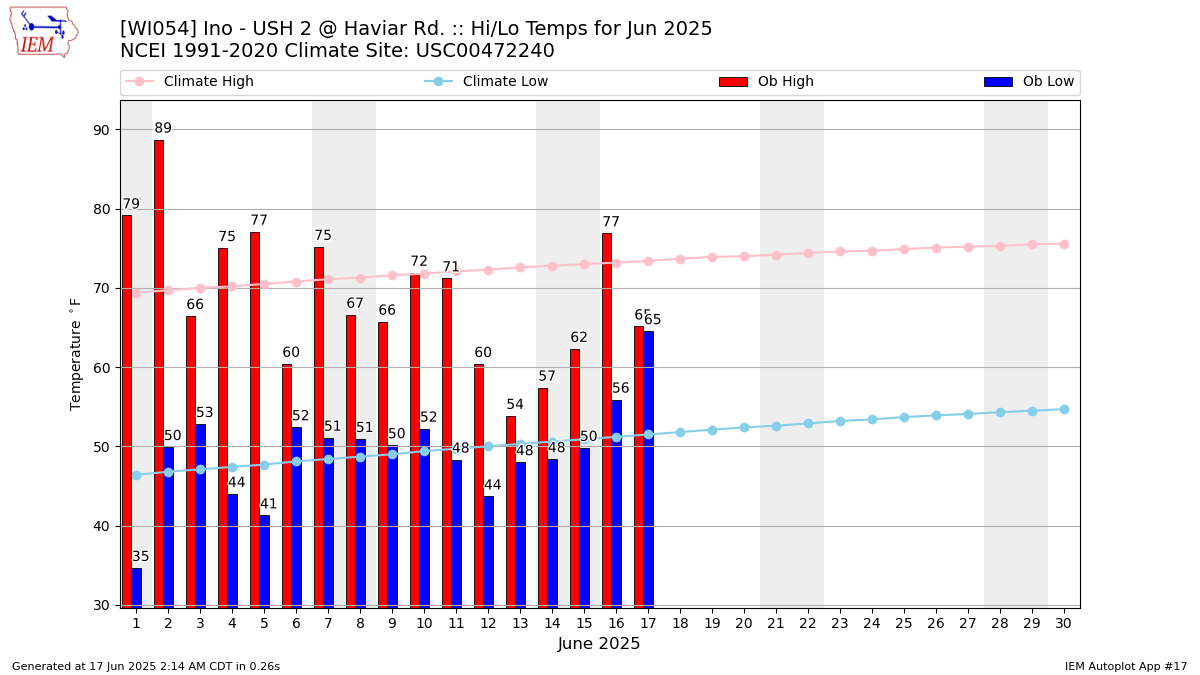
Description: This chart of the monthly temperature data. The bars are the observations and the dots are climatology.
Daily Rainfall
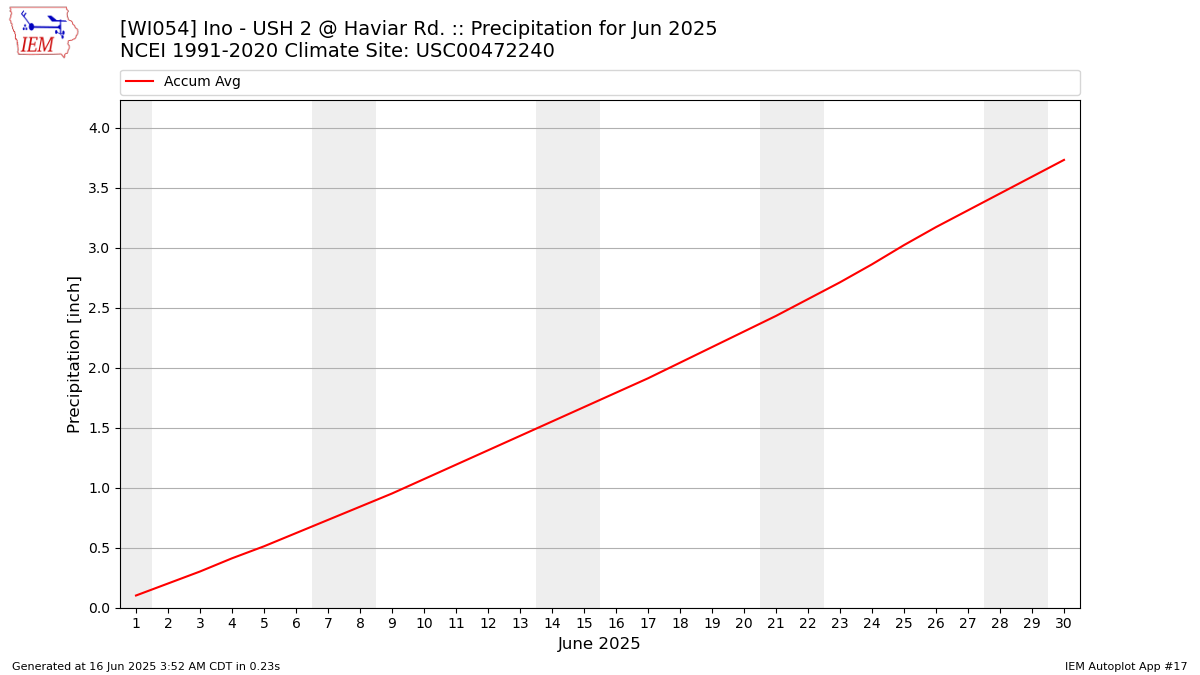
Description: This chart is of daily precipitation for the month. The red line would be an average month while the blue line and bars are observations.
Daily Average Wind Speeds
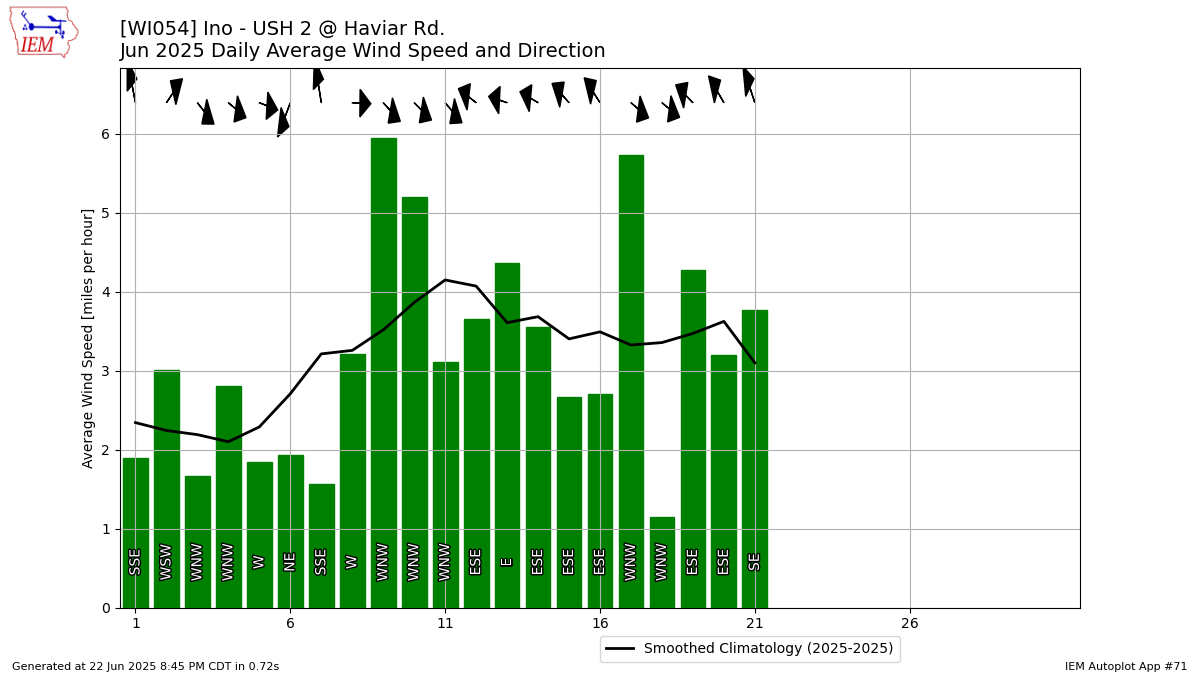
Description: This chart is of the daily average wind speeds.
The data presented here provided by IEM API webservice: daily.json. A simple CSV option exists as well.