| May 2025 | Jun 2025 | Jul 2025 | ||||
|---|---|---|---|---|---|---|
| Sunday | Monday | Tuesday | Wednesday | Thursday | Friday | Saturday |
| 01 High: -0.0004107666 Low: -0.0004107666 Precip: M Avg Wind: SW @ 0.9 RH% Min/Max: 100-100 Feel Min/Max: -17 to -0 | 02 High: -0.0004107666 Low: -0.0004107666 Precip: M Avg Wind: SSW @ 5.8 RH% Min/Max: 100-100 Feel Min/Max: -20 to -0 | 03 High: 22.870405 Low: -0.0004107666 Precip: M Avg Wind: SW @ 2.2 RH% Min/Max: 100-100 Feel Min/Max: -15 to 23 | 04 High: -0.0004107666 Low: -0.0004107666 Precip: M Avg Wind: WSW @ 0.5 RH% Min/Max: 100-100 Feel Min/Max: -14 to -0 | 05 High: -0.0004107666 Low: -0.0004107666 Precip: M Avg Wind: SW @ 0.6 RH% Min/Max: 100-100 Feel Min/Max: -16 to -0 | 06 High: 8.909584 Low: -0.0004107666 Precip: M Avg Wind: NE @ 1.2 RH% Min/Max: 100-100 Feel Min/Max: -17 to 5 | 07 High: 0.030213622 Low: -0.0004107666 Precip: M Avg Wind: SSW @ 2.7 RH% Min/Max: 100-100 Feel Min/Max: -17 to -0 |
| 08 High: 10.86081 Low: -0.0004107666 Precip: M Avg Wind: SW @ 5.1 RH% Min/Max: 100-100 Feel Min/Max: -19 to 7 | 09 High: 4.7497754 Low: -0.0004107666 Precip: M Avg Wind: SW @ 3.3 RH% Min/Max: 100-100 Feel Min/Max: -17 to 4 | 10 High: 0.01939209 Low: -0.0004107666 Precip: M Avg Wind: SW @ 1.5 RH% Min/Max: 100-100 Feel Min/Max: -16 to -0 | 11 High: -0.0004107666 Low: -0.0004107666 Precip: M Avg Wind: W @ 0.5 RH% Min/Max: 100-100 Feel Min/Max: -12 to -0 | 12 High: 3.290022 Low: -0.0004107666 Precip: M Avg Wind: NE @ 3.1 RH% Min/Max: 100-100 Feel Min/Max: -16 to 3 | 13 High: 10.790607 Low: -0.0004107666 Precip: M Avg Wind: NE @ 6.8 RH% Min/Max: 100-100 Feel Min/Max: -20 to 2 | 14 High: 13.899189 Low: -0.0004107666 Precip: M RH% Min/Max: 100-100 Feel Min/Max: -15 to 14 |
| 15 Precip: M | 16 | 17 | 18 | 19 | 20 | 21 |
| 22 | 23 | 24 | 25 | 26 | 27 | 28 |
| 29 | 30 | 01 | 02 | 03 | 04 | 05 |
The data presented here provided by IEM API webservice: daily.json. A simple CSV option exists as well.
Daily High/Low Plot
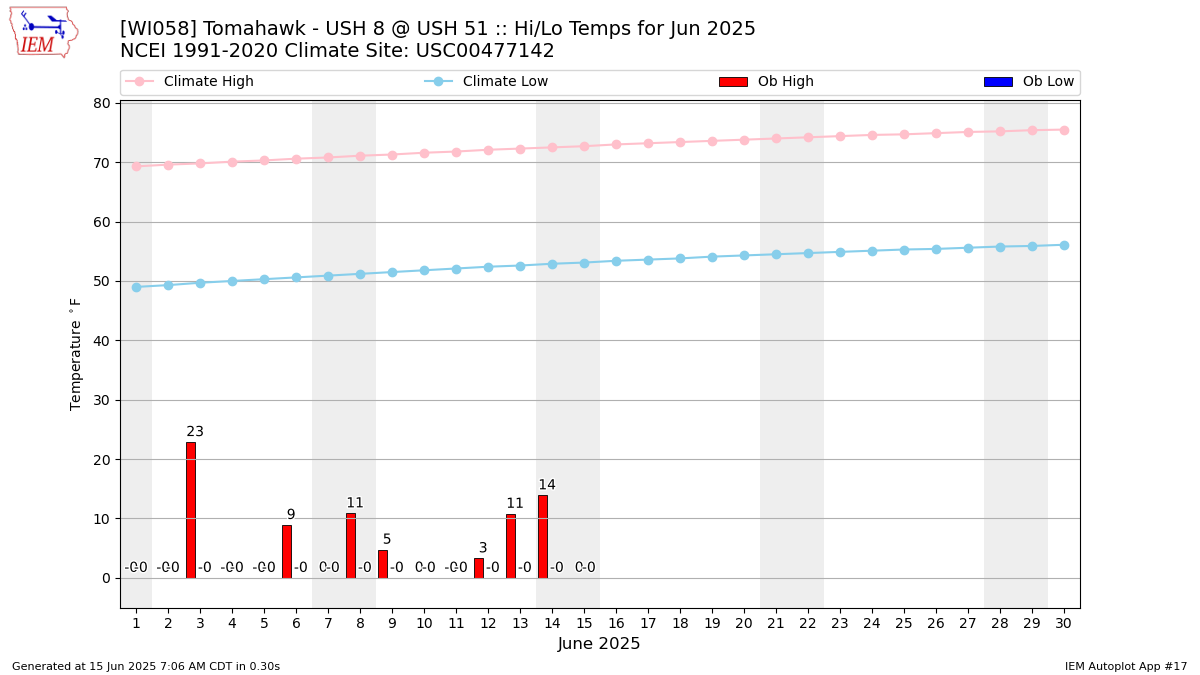
Description: This chart of the monthly temperature data. The bars are the observations and the dots are climatology.
Daily Rainfall
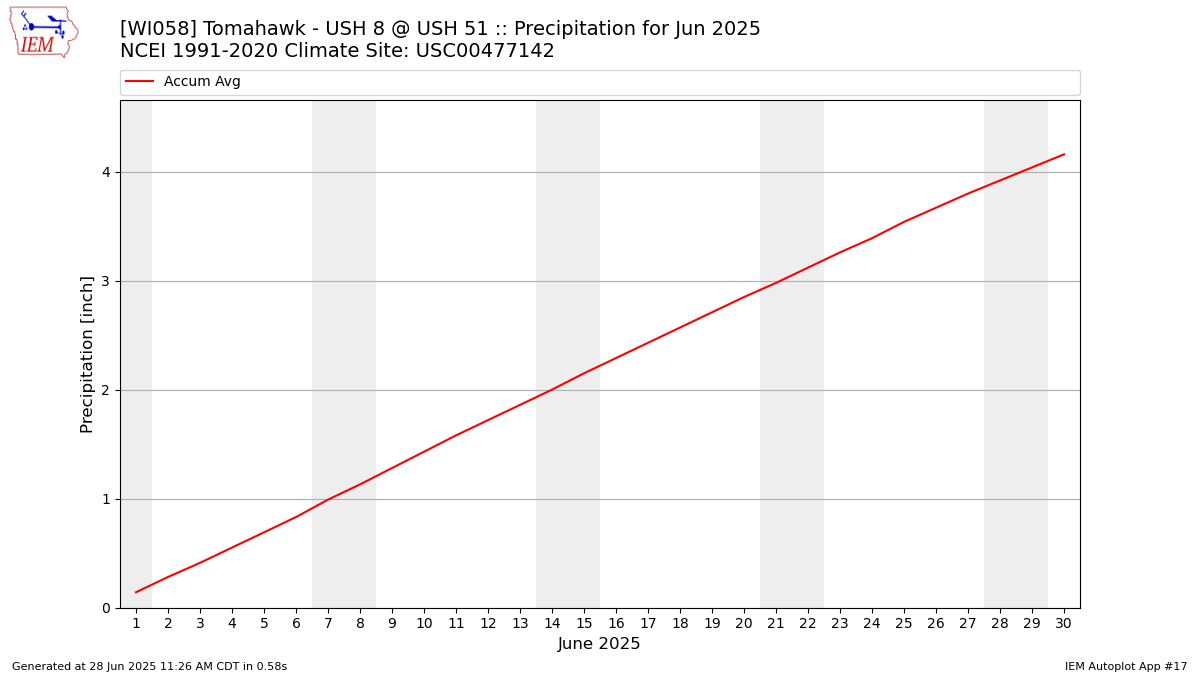
Description: This chart is of daily precipitation for the month. The red line would be an average month while the blue line and bars are observations.
Daily Average Wind Speeds
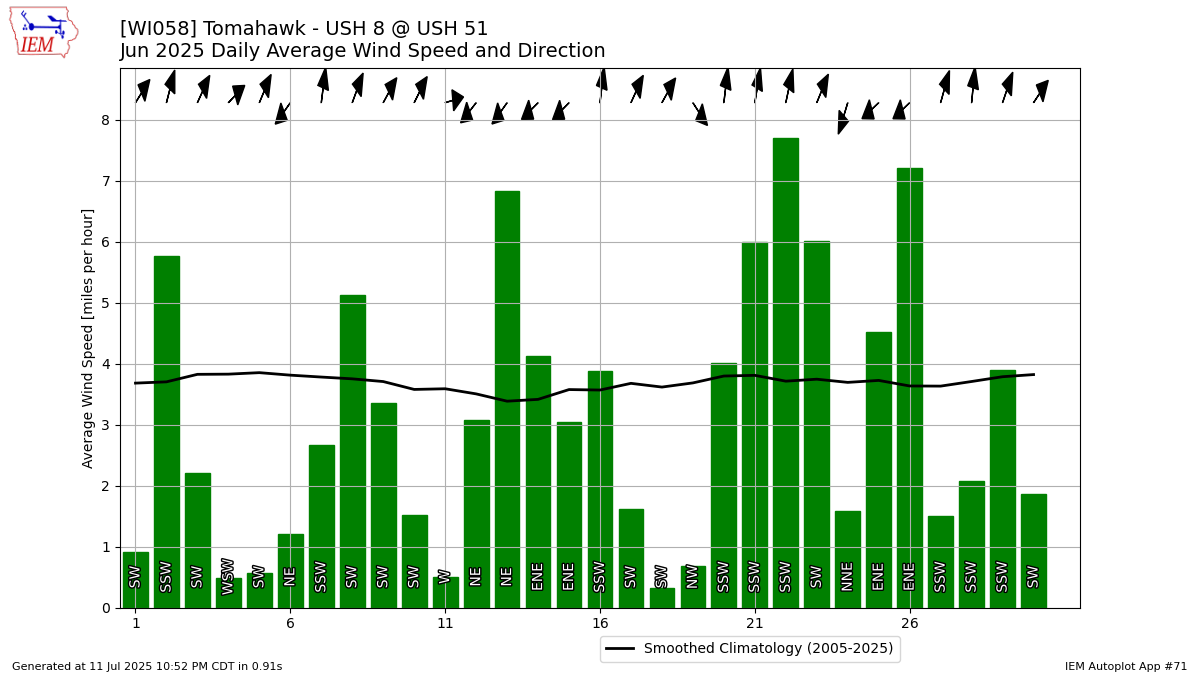
Description: This chart is of the daily average wind speeds.
The data presented here provided by IEM API webservice: daily.json. A simple CSV option exists as well.