| May 2025 | Jun 2025 | Jul 2025 | ||||
|---|---|---|---|---|---|---|
| Sunday | Monday | Tuesday | Wednesday | Thursday | Friday | Saturday |
| 01 High: 73.81039 Low: 39.21982 Precip: M Avg Wind: SE @ 1.7 RH% Min/Max: 36-100 Feel Min/Max: 39 to 74 | 02 High: 83.08938 Low: 56.66001 Precip: M Avg Wind: SSW @ 2.8 RH% Min/Max: 45-70 Feel Min/Max: 57 to 84 | 03 High: 81.21918 Low: 58.989223 Precip: M Avg Wind: SSW @ 3.6 RH% Min/Max: 69-100 Feel Min/Max: 59 to 86 | 04 High: 74.76982 Low: 56.350418 Precip: M Avg Wind: ENE @ 1.2 RH% Min/Max: 55-100 Feel Min/Max: 56 to 75 | 05 High: 78.40041 Low: 51.200577 Precip: M Avg Wind: E @ 1.7 RH% Min/Max: 42-100 Feel Min/Max: 51 to 78 | 06 High: 75.11001 Low: 59.640823 Precip: M Avg Wind: ENE @ 2.2 RH% Min/Max: 50-100 Feel Min/Max: 60 to 75 | 07 High: 77.219604 Low: 58.679573 Precip: M Avg Wind: ESE @ 2.3 RH% Min/Max: 46-100 Feel Min/Max: 59 to 77 |
| 08 High: 70.359795 Low: 58.989223 Precip: M Avg Wind: SW @ 2.5 RH% Min/Max: 65-100 Feel Min/Max: 59 to 70 | 09 High: 63.049988 Low: 54.96982 Precip: M Avg Wind: W @ 3.4 RH% Min/Max: 71-100 Feel Min/Max: 55 to 63 | 10 High: 68.250206 Low: 54.91939 Precip: M Avg Wind: WSW @ 2.6 RH% Min/Max: 78-100 Feel Min/Max: 55 to 68 | 11 High: 82.880585 Low: 61.840393 Precip: M Avg Wind: WSW @ 2.8 RH% Min/Max: 46-97 Feel Min/Max: 62 to 84 | 12 High: 70.26081 Low: 59.320404 Precip: M Avg Wind: ENE @ 3.5 RH% Min/Max: 63-100 Feel Min/Max: 59 to 70 | 13 High: 62.85921 Low: 53.14999 Precip: M Avg Wind: ENE @ 5.8 RH% Min/Max: 70-100 Feel Min/Max: 53 to 63 | 14 High: 78.99082 Low: 53.299404 Precip: M Avg Wind: ENE @ 3.1 RH% Min/Max: 68-100 Feel Min/Max: 53 to 79 |
| 15 High: 76.8308 Low: 56.499775 Precip: M Avg Wind: ENE @ 2.2 RH% Min/Max: 78-100 Feel Min/Max: 56 to 77 | 16 High: 79.39941 Low: 62.69002 Precip: M Avg Wind: S @ 1.8 RH% Min/Max: 86-100 Feel Min/Max: 63 to 79 | 17 High: 69.81982 Low: 68.250206 Precip: M RH% Min/Max: 100-100 Feel Min/Max: 68 to 70 | 18 Precip: M | 19 | 20 | 21 |
| 22 | 23 | 24 | 25 | 26 | 27 | 28 |
| 29 | 30 | 01 | 02 | 03 | 04 | 05 |
The data presented here provided by IEM API webservice: daily.json. A simple CSV option exists as well.
Daily High/Low Plot
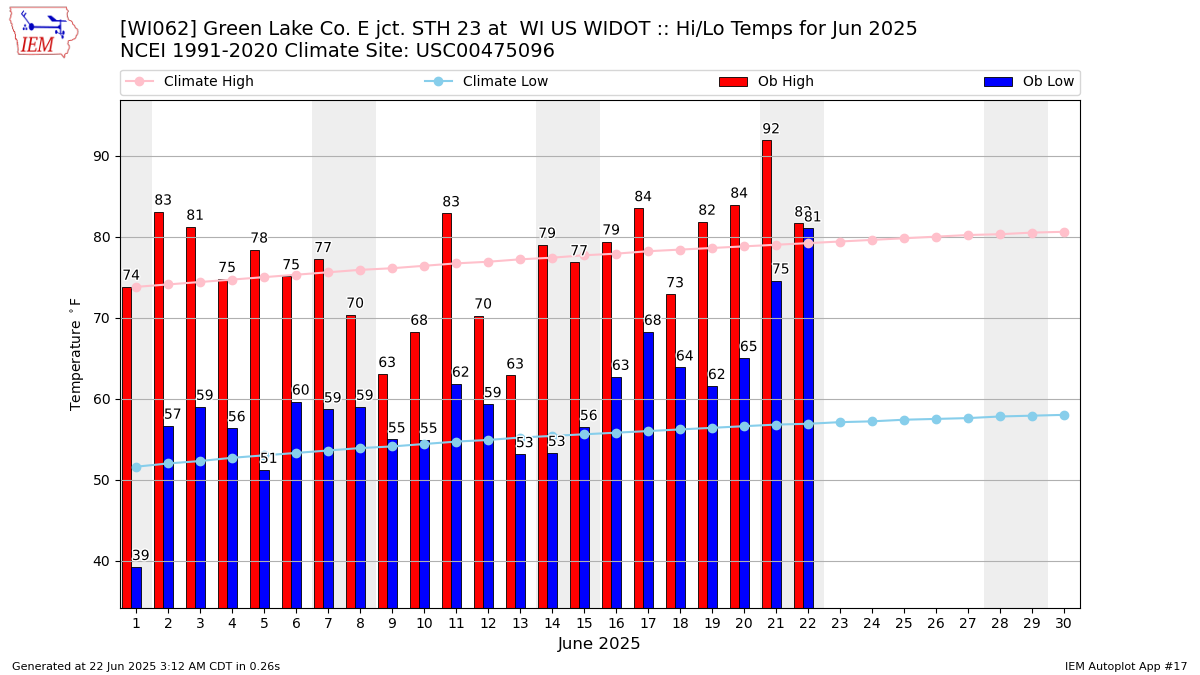
Description: This chart of the monthly temperature data. The bars are the observations and the dots are climatology.
Daily Rainfall
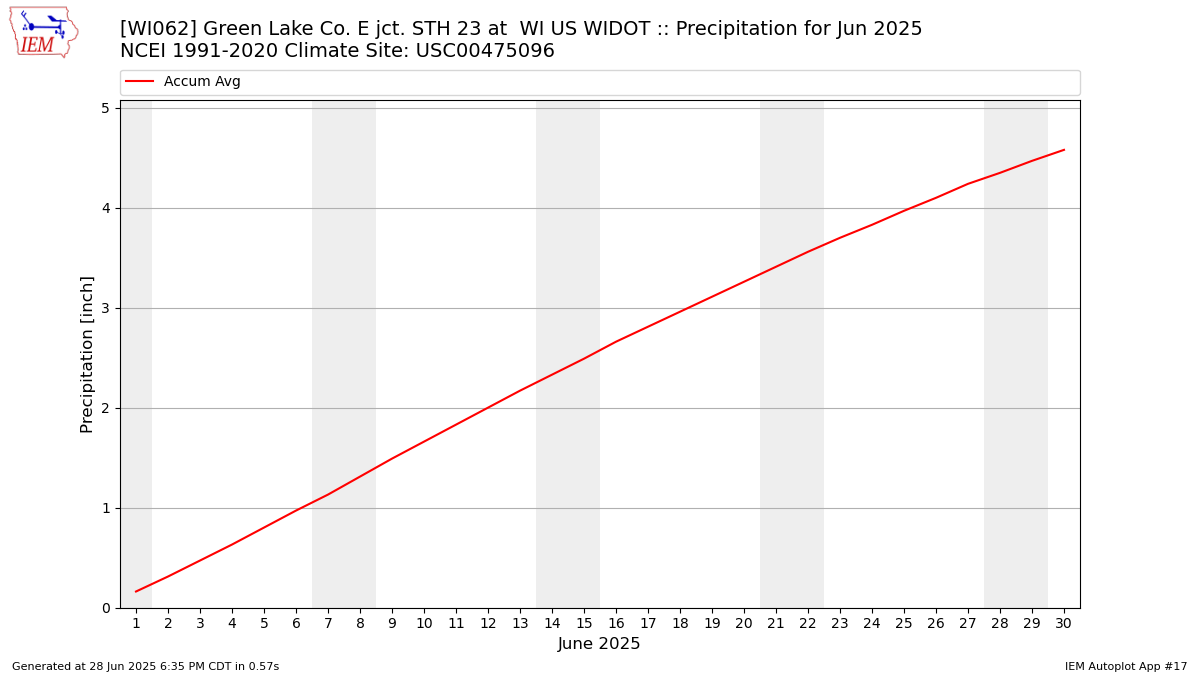
Description: This chart is of daily precipitation for the month. The red line would be an average month while the blue line and bars are observations.
Daily Average Wind Speeds
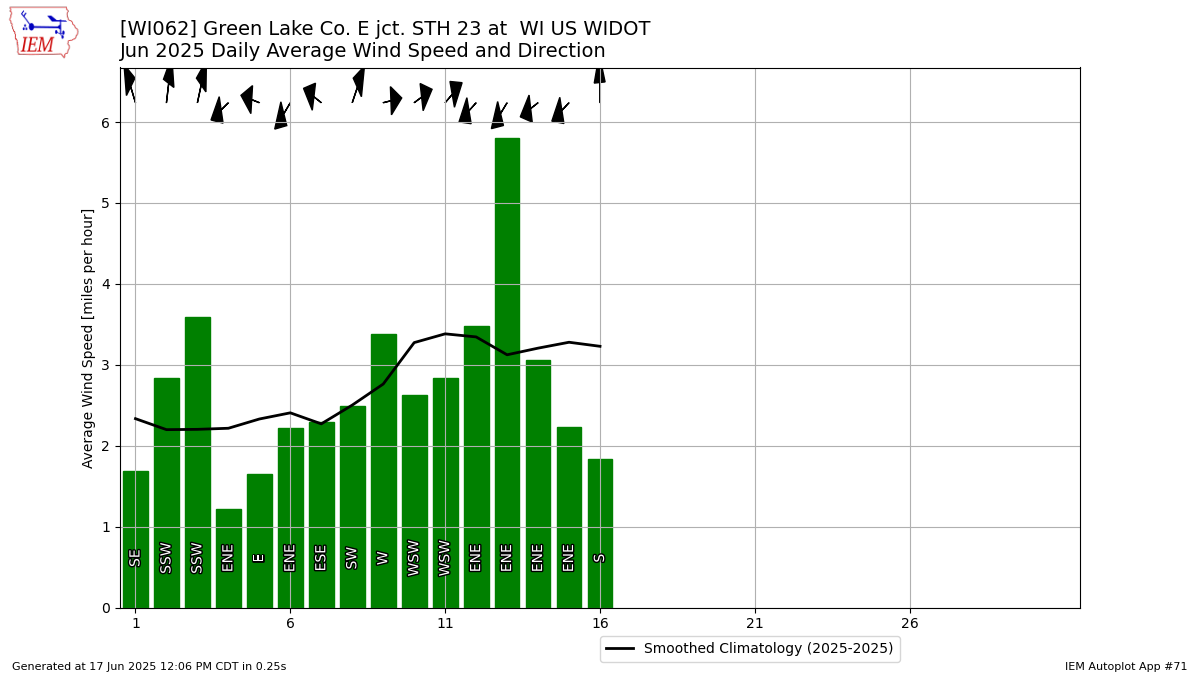
Description: This chart is of the daily average wind speeds.
The data presented here provided by IEM API webservice: daily.json. A simple CSV option exists as well.