| May 2025 | Jun 2025 | Jul 2025 | ||||
|---|---|---|---|---|---|---|
| Sunday | Monday | Tuesday | Wednesday | Thursday | Friday | Saturday |
| 01 High: 69.119606 Low: 44.209427 Precip: M Avg Wind: N @ 0.0 RH% Min/Max: 35-74 Feel Min/Max: 50 to 69 | 02 High: 81.21918 Low: 52.3292 Precip: M Avg Wind: N @ 0.0 RH% Min/Max: 36-72 Feel Min/Max: 52 to 81 | 03 High: 82.04002 Low: 59.320404 Precip: M Avg Wind: N @ 0.0 RH% Min/Max: 56-99 Feel Min/Max: 59 to 84 | 04 High: 74.28922 Low: 56.960598 Precip: M Avg Wind: N @ 0.0 RH% Min/Max: 45-99 Feel Min/Max: 57 to 74 | 05 High: 76.92078 Low: 55.11918 Precip: M Avg Wind: N @ 0.0 RH% Min/Max: 36-90 Feel Min/Max: 55 to 77 | 06 High: 74.93 Low: 60.81081 Precip: M Avg Wind: N @ 0.0 RH% Min/Max: 36-81 Feel Min/Max: 61 to 75 | 07 High: 76.049614 Low: 61.399403 Precip: M Avg Wind: N @ 0.0 RH% Min/Max: 35-76 Feel Min/Max: 61 to 76 |
| 08 High: 71.07078 Low: 55.239807 Precip: M Avg Wind: N @ 0.0 RH% Min/Max: 58-99 Feel Min/Max: 55 to 71 | 09 High: 62.369606 Low: 54.860012 Precip: M Avg Wind: N @ 0.0 RH% Min/Max: 64-87 Feel Min/Max: 55 to 62 | 10 High: 65.17941 Low: 54.820404 Precip: M Avg Wind: N @ 0.0 RH% Min/Max: 70-90 Feel Min/Max: 55 to 65 | 11 High: 81.62963 Low: 57.900204 Precip: M Avg Wind: N @ 0.0 RH% Min/Max: 43-86 Feel Min/Max: 58 to 82 | 12 High: 68.77041 Low: 58.83981 Precip: M Avg Wind: N @ 0.0 RH% Min/Max: 56-84 Feel Min/Max: 59 to 69 | 13 High: 61.399403 Low: 54.269608 Precip: M Avg Wind: N @ 0.0 RH% Min/Max: 60-92 Feel Min/Max: 54 to 61 | 14 High: 54.660225 Low: 54.049988 Precip: M RH% Min/Max: 88-92 Feel Min/Max: 54 to 55 |
| 15 Precip: M | 16 | 17 | 18 | 19 | 20 | 21 |
| 22 | 23 | 24 | 25 | 26 | 27 | 28 |
| 29 | 30 | 01 | 02 | 03 | 04 | 05 |
The data presented here provided by IEM API webservice: daily.json. A simple CSV option exists as well.
Daily High/Low Plot
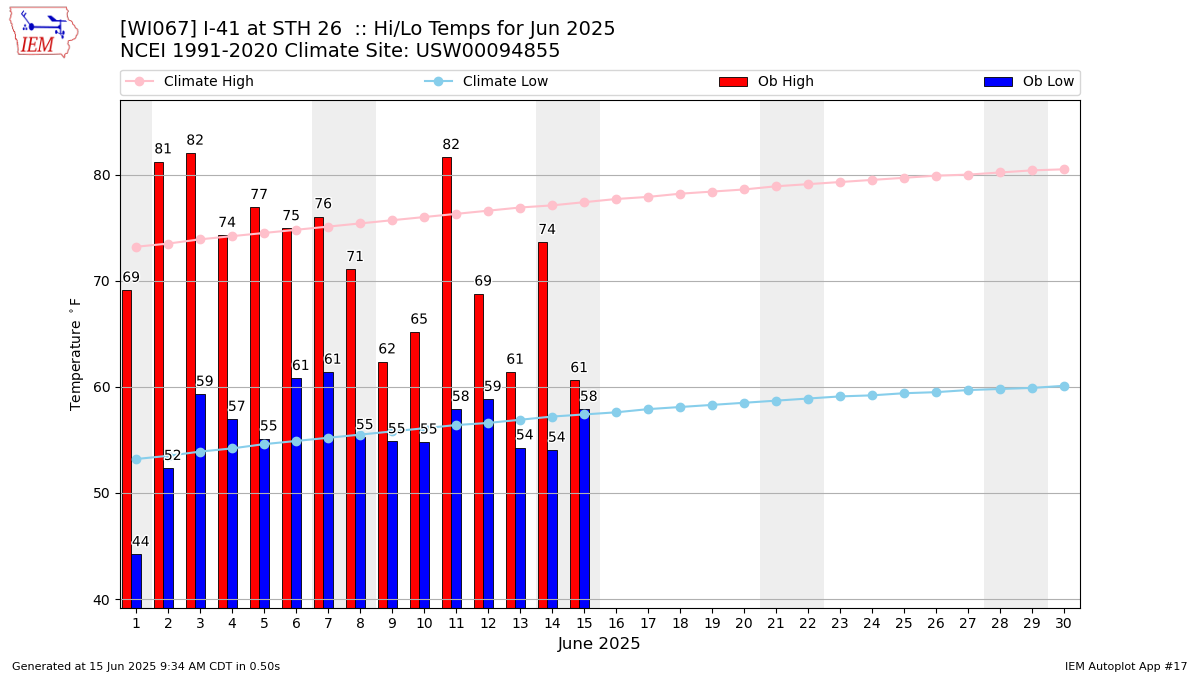
Description: This chart of the monthly temperature data. The bars are the observations and the dots are climatology.
Daily Rainfall
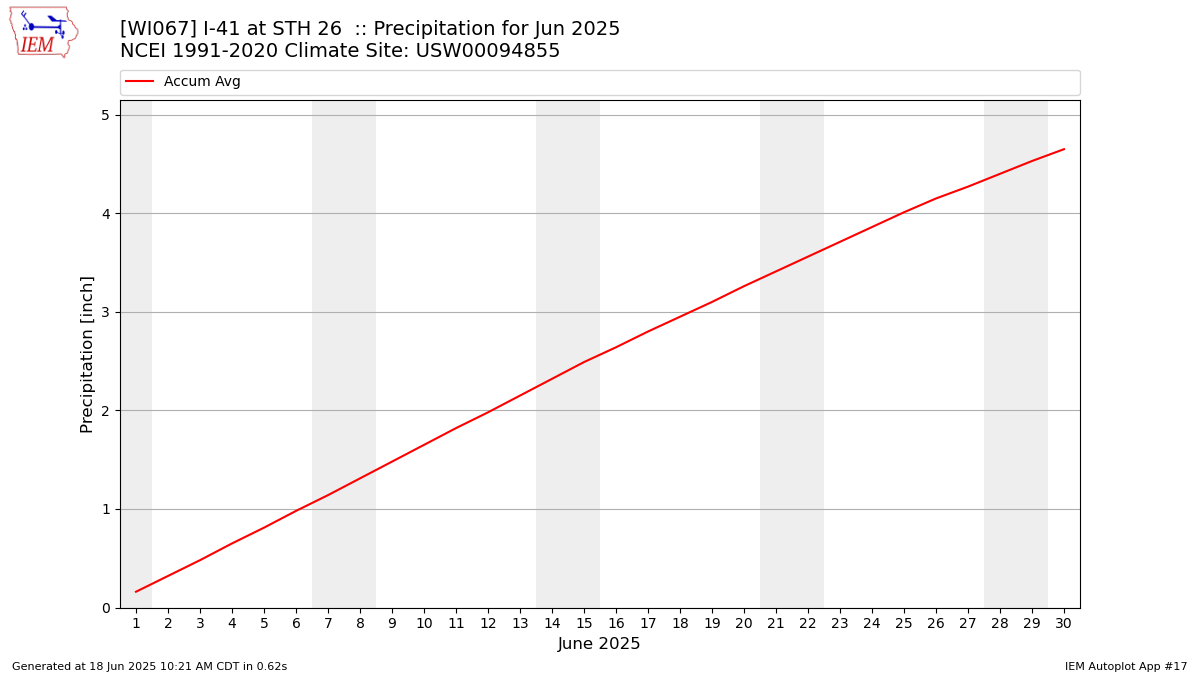
Description: This chart is of daily precipitation for the month. The red line would be an average month while the blue line and bars are observations.
Daily Average Wind Speeds
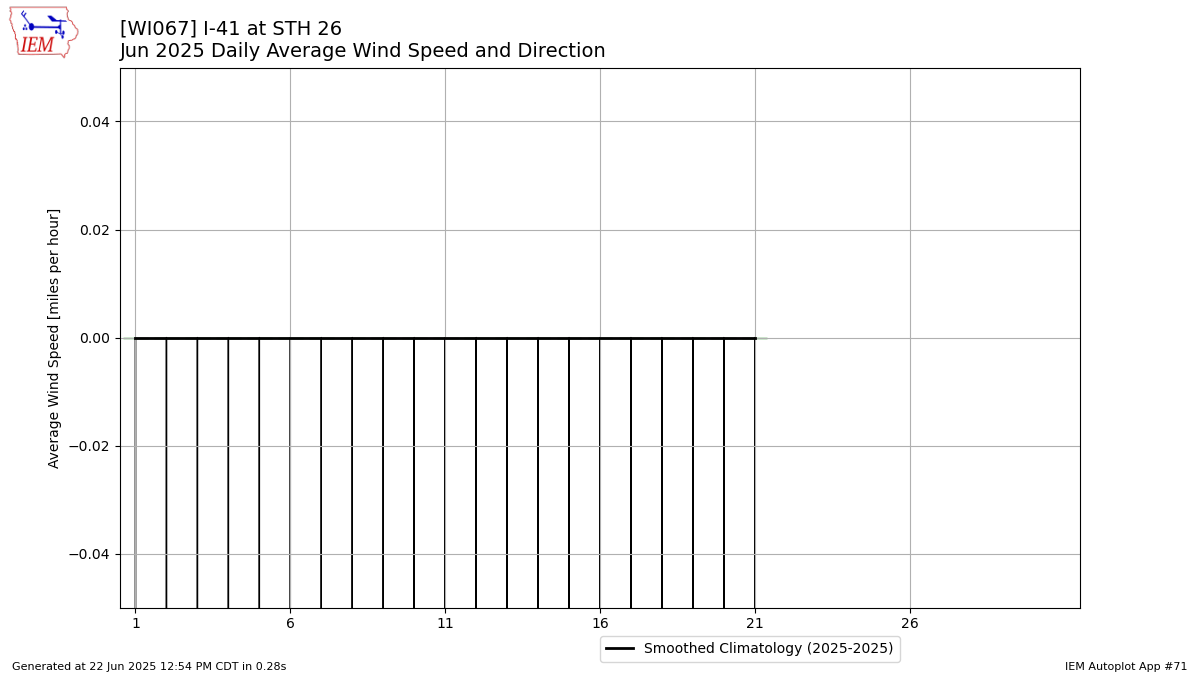
Description: This chart is of the daily average wind speeds.
The data presented here provided by IEM API webservice: daily.json. A simple CSV option exists as well.