| May 2025 | Jun 2025 | Jul 2025 | ||||
|---|---|---|---|---|---|---|
| Sunday | Monday | Tuesday | Wednesday | Thursday | Friday | Saturday |
| 01 High: 68.419395 Low: 42.6308 Precip: M Avg Wind: SSE @ 5.4 RH% Min/Max: 37-76 Feel Min/Max: 43 to 68 | 02 High: 81.42979 Low: 54.820404 Precip: M Avg Wind: SSW @ 8.0 RH% Min/Max: 33-65 Feel Min/Max: 55 to 80 | 03 High: 81.62963 Low: 59.640823 Precip: M Avg Wind: SW @ 12.1 RH% Min/Max: 54-100 Feel Min/Max: 60 to 83 | 04 High: 74.37019 Low: 58.350204 Precip: M Avg Wind: S @ 4.7 RH% Min/Max: 45-100 Feel Min/Max: 58 to 74 | 05 High: 78.009796 Low: 56.98938 Precip: M Avg Wind: SSE @ 3.1 RH% Min/Max: 36-90 Feel Min/Max: 57 to 78 | 06 High: 75.11001 Low: 61.0502 Precip: M Avg Wind: ENE @ 5.6 RH% Min/Max: 36-72 Feel Min/Max: 61 to 75 | 07 High: 76.51038 Low: 60.859425 Precip: M Avg Wind: SE @ 6.1 RH% Min/Max: 35-69 Feel Min/Max: 61 to 77 |
| 08 High: 70.89983 Low: 59.320404 Precip: M Avg Wind: WSW @ 6.1 RH% Min/Max: 52-100 Feel Min/Max: 59 to 71 | 09 High: 62.810596 Low: 55.41982 Precip: M Avg Wind: WNW @ 8.5 RH% Min/Max: 61-85 Feel Min/Max: 55 to 63 | 10 High: 66.01998 Low: 56.19919 Precip: M Avg Wind: WNW @ 8.3 RH% Min/Max: 66-90 Feel Min/Max: 56 to 66 | 11 High: 81.84018 Low: 61.559586 Precip: M Avg Wind: WNW @ 8.9 RH% Min/Max: 43-82 Feel Min/Max: 62 to 82 | 12 High: 70.359795 Low: 59.149403 Precip: M Avg Wind: E @ 8.1 RH% Min/Max: 52-73 Feel Min/Max: 59 to 70 | 13 High: 60.27078 Low: 54.049988 Precip: M Avg Wind: ENE @ 11.6 RH% Min/Max: 56-89 Feel Min/Max: 54 to 60 | 14 High: 55.889595 Low: 54.049988 Precip: M RH% Min/Max: 81-87 Feel Min/Max: 54 to 56 |
| 15 Precip: M | 16 | 17 | 18 | 19 | 20 | 21 |
| 22 | 23 | 24 | 25 | 26 | 27 | 28 |
| 29 | 30 | 01 | 02 | 03 | 04 | 05 |
The data presented here provided by IEM API webservice: daily.json. A simple CSV option exists as well.
Daily High/Low Plot
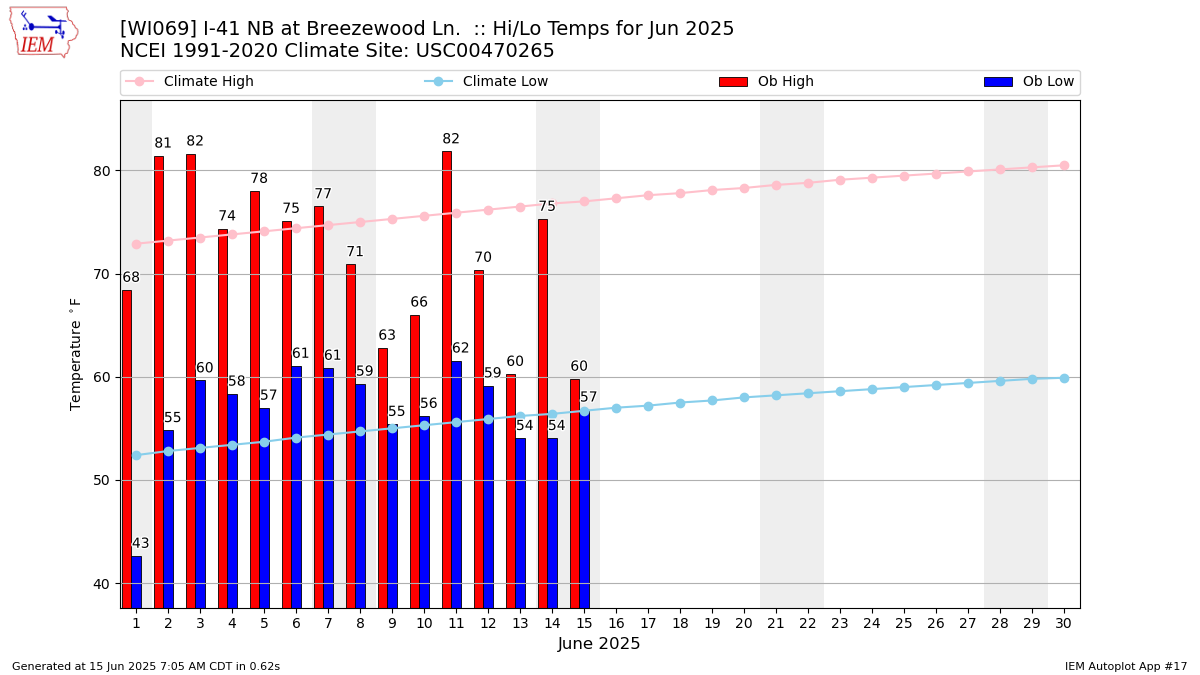
Description: This chart of the monthly temperature data. The bars are the observations and the dots are climatology.
Daily Rainfall
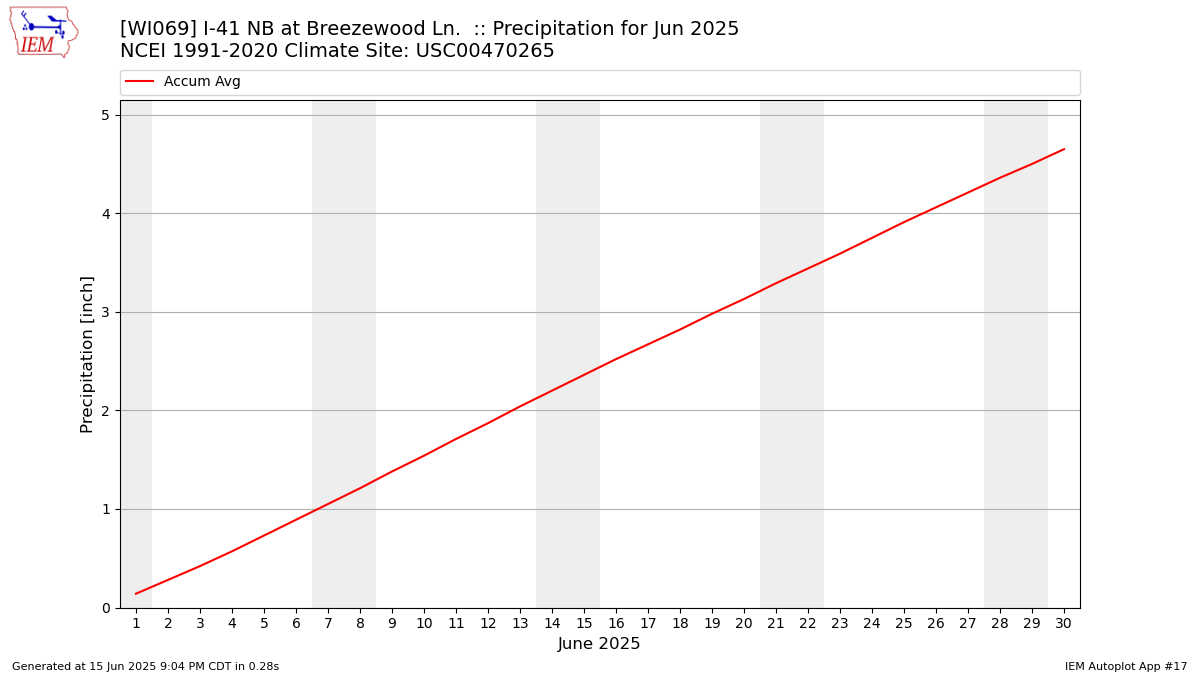
Description: This chart is of daily precipitation for the month. The red line would be an average month while the blue line and bars are observations.
Daily Average Wind Speeds
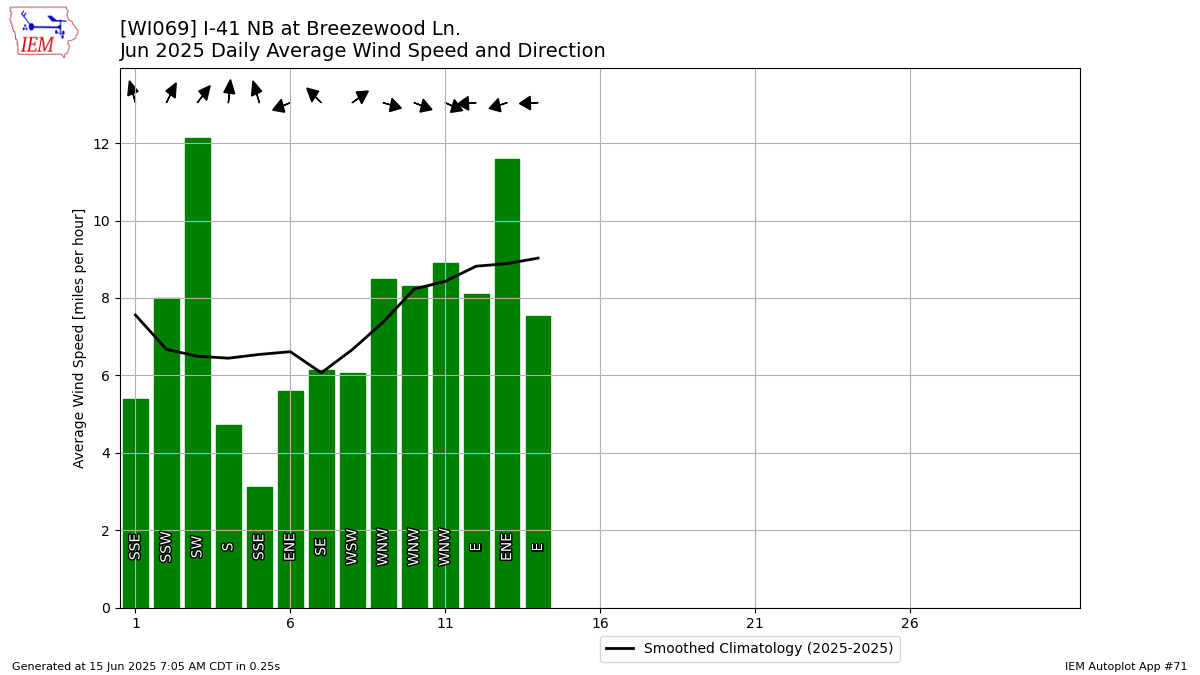
Description: This chart is of the daily average wind speeds.
The data presented here provided by IEM API webservice: daily.json. A simple CSV option exists as well.