| May 2025 | Jun 2025 | Jul 2025 | ||||
|---|---|---|---|---|---|---|
| Sunday | Monday | Tuesday | Wednesday | Thursday | Friday | Saturday |
| 01 High: 77.9792 Low: 34.86918 Precip: M Avg Wind: S @ 2.1 Gust: 14 (1:39 PM) RH% Min/Max: 26-100 Feel Min/Max: 33 to 78 | 02 High: 87.09978 Low: 60.99082 Precip: M Avg Wind: SSW @ 5.5 Gust: 27 (3:09 PM) RH% Min/Max: 36-76 Feel Min/Max: 61 to 86 | 03 High: 72.14002 Low: 49.989223 Precip: M Avg Wind: WNW @ 2.6 Gust: 17 (1:19 AM) RH% Min/Max: 65-100 Feel Min/Max: 50 to 72 | 04 High: 75.46998 Low: 47.4494 Precip: M Avg Wind: W @ 2.3 Gust: 19 (12:39 PM) RH% Min/Max: 30-100 Feel Min/Max: 47 to 75 | 05 High: 77.75958 Low: 43.5308 Precip: M Avg Wind: SSW @ 2.5 Gust: 15 (3:19 PM) RH% Min/Max: 27-100 Feel Min/Max: 44 to 78 | 06 High: 63.96982 Low: 52.109585 Precip: M Avg Wind: ENE @ 1.3 Gust: 12 (10:39 AM) RH% Min/Max: 62-100 Feel Min/Max: 52 to 64 | 07 High: 75.95959 Low: 53.119392 Precip: M Avg Wind: SSE @ 5.3 Gust: 24 (7:29 PM) RH% Min/Max: 42-96 Feel Min/Max: 53 to 76 |
| 08 High: 69.31939 Low: 50.739807 Precip: M Avg Wind: SSW @ 4.7 Gust: 28 (4:09 AM) RH% Min/Max: 42-100 Feel Min/Max: 51 to 69 | 09 High: 64.20921 Low: 49.96939 Precip: M Avg Wind: NW @ 3.3 Gust: 20 (4:39 PM) RH% Min/Max: 61-100 Feel Min/Max: 50 to 64 | 10 High: 67.92078 Low: 51.13043 Precip: M Avg Wind: W @ 4.4 Gust: 17 (1:59 PM) RH% Min/Max: 62-94 Feel Min/Max: 51 to 68 | 11 High: 69.5696 Low: 47.620407 Precip: M Avg Wind: NW @ 2.9 Gust: 15 (11:19 AM) RH% Min/Max: 57-100 Feel Min/Max: 48 to 70 | 12 High: 69.51022 Low: 41.399616 Precip: M Avg Wind: NE @ 1.6 Gust: 15 (2:19 PM) RH% Min/Max: 49-100 Feel Min/Max: 41 to 70 | 13 High: 56.71939 Low: 47.969604 Precip: M Avg Wind: ESE @ 1.8 Gust: 14 (2:49 PM) RH% Min/Max: 63-98 Feel Min/Max: 48 to 57 | 14 High: 58.620193 Low: 47.699615 Precip: M Avg Wind: E @ 1.5 Gust: 12 (9:09 AM) RH% Min/Max: 86-100 Feel Min/Max: 48 to 59 |
| 15 High: 69.5696 Low: 52.829628 Precip: M Avg Wind: ESE @ 2.2 Gust: 14 (11:59 PM) RH% Min/Max: 69-100 Feel Min/Max: 53 to 70 | 16 High: 78.36982 Low: 61.030373 Precip: M Avg Wind: SSE @ 3.2 Gust: 22 (11:39 PM) RH% Min/Max: 69-100 Feel Min/Max: 61 to 78 | 17 High: 79.309425 Low: 64.41081 Precip: M Gust: 23 (1:59 AM) RH% Min/Max: 56-94 Feel Min/Max: 64 to 79 | 18 Precip: M | 19 | 20 | 21 |
| 22 | 23 | 24 | 25 | 26 | 27 | 28 |
| 29 | 30 | 01 | 02 | 03 | 04 | 05 |
The data presented here provided by IEM API webservice: daily.json. A simple CSV option exists as well.
Daily High/Low Plot
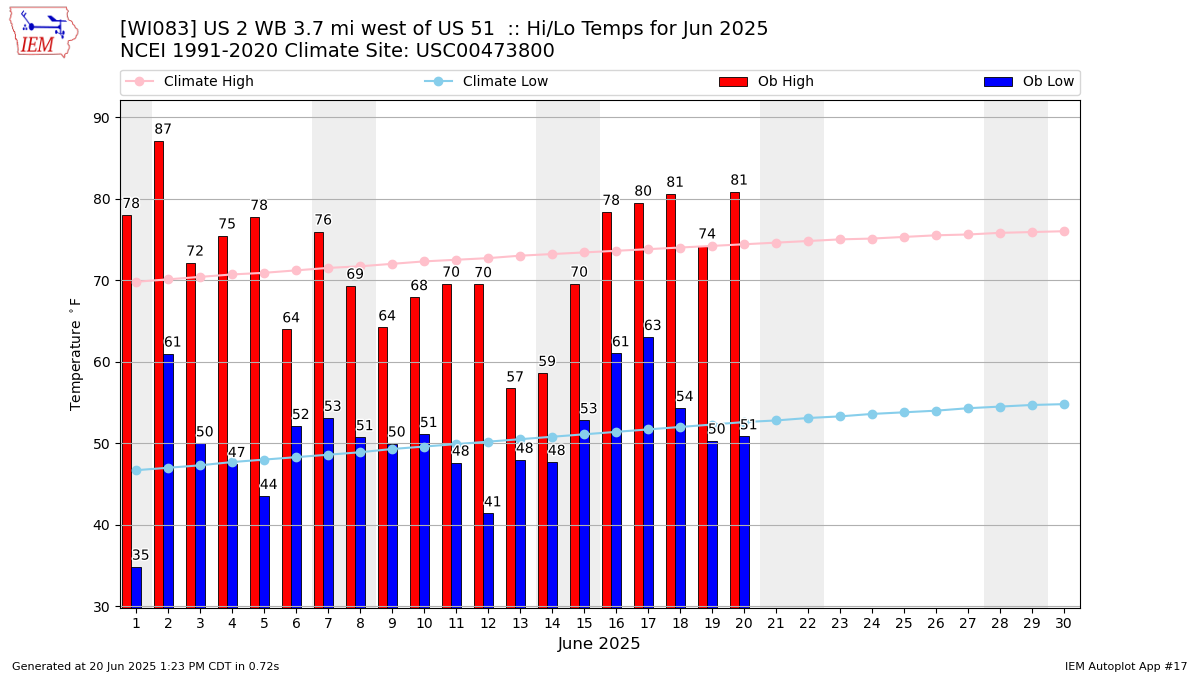
Description: This chart of the monthly temperature data. The bars are the observations and the dots are climatology.
Daily Rainfall
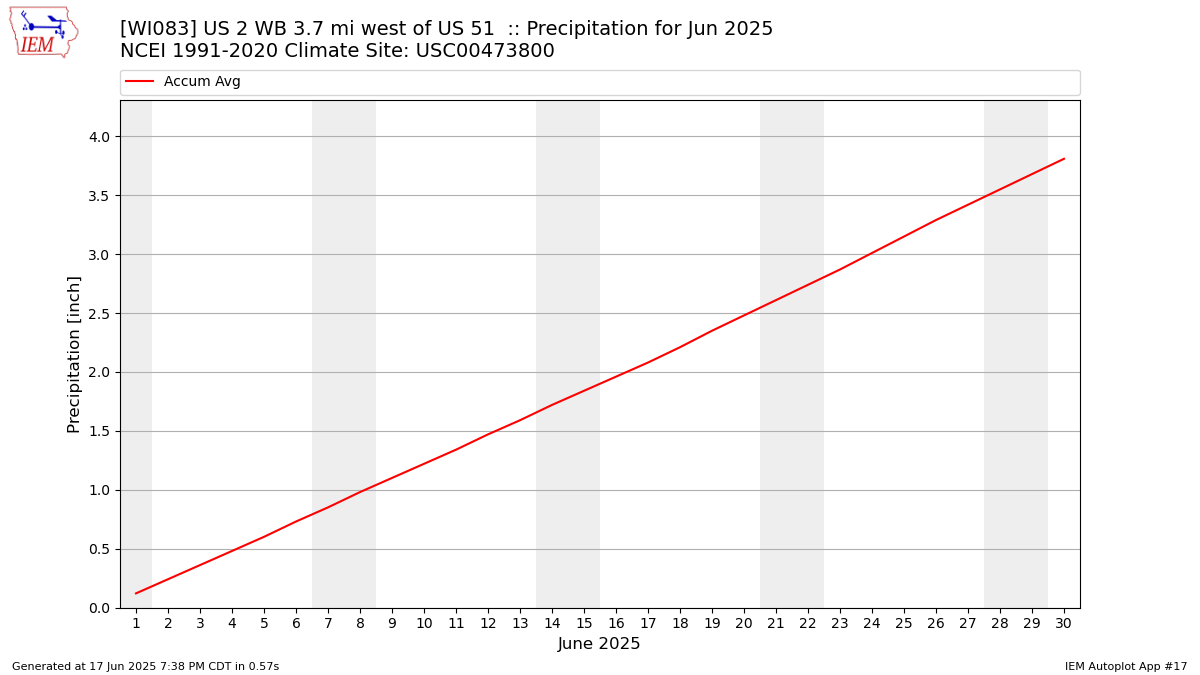
Description: This chart is of daily precipitation for the month. The red line would be an average month while the blue line and bars are observations.
Daily Average Wind Speeds
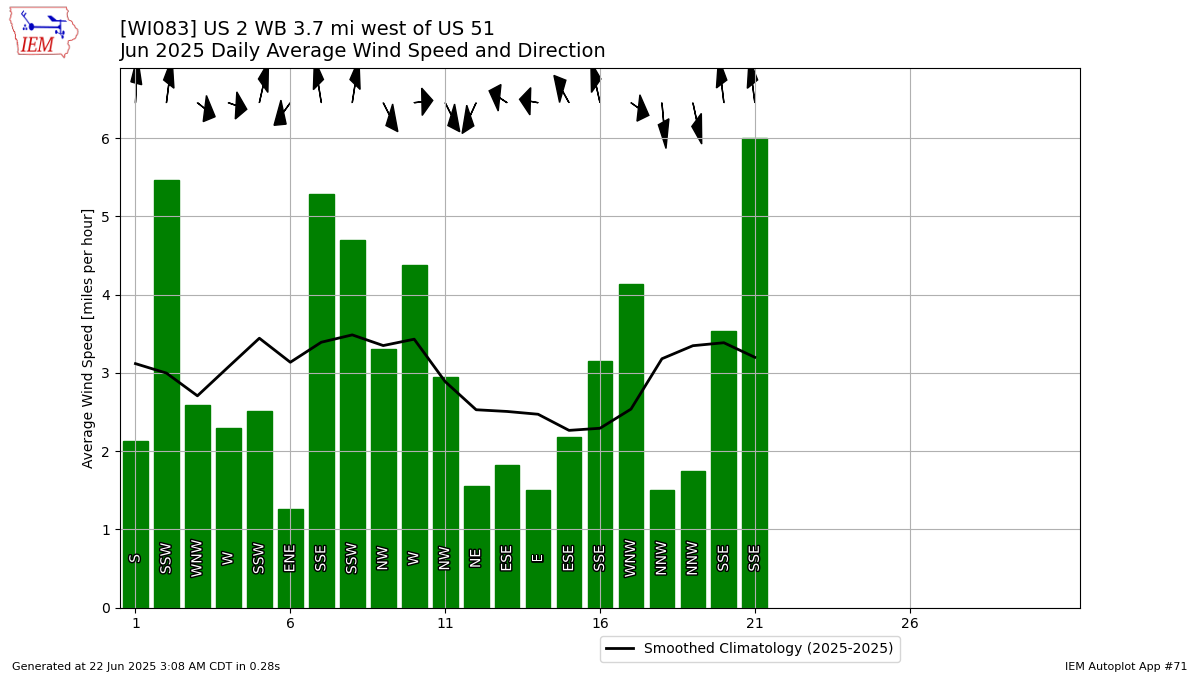
Description: This chart is of the daily average wind speeds.
The data presented here provided by IEM API webservice: daily.json. A simple CSV option exists as well.