The following tables present IEM computed monthly data summaries based on
daily data provided by or computed for the IEM. A download interface
exists for the daily summary information. The climatology is provided by the
nearest NCEI climate station (USW00053146) within the current 1991-2020
dataset.
To load shown data into Microsoft Excel,
highlight the table information with your mouse and then copy/paste into Excel.
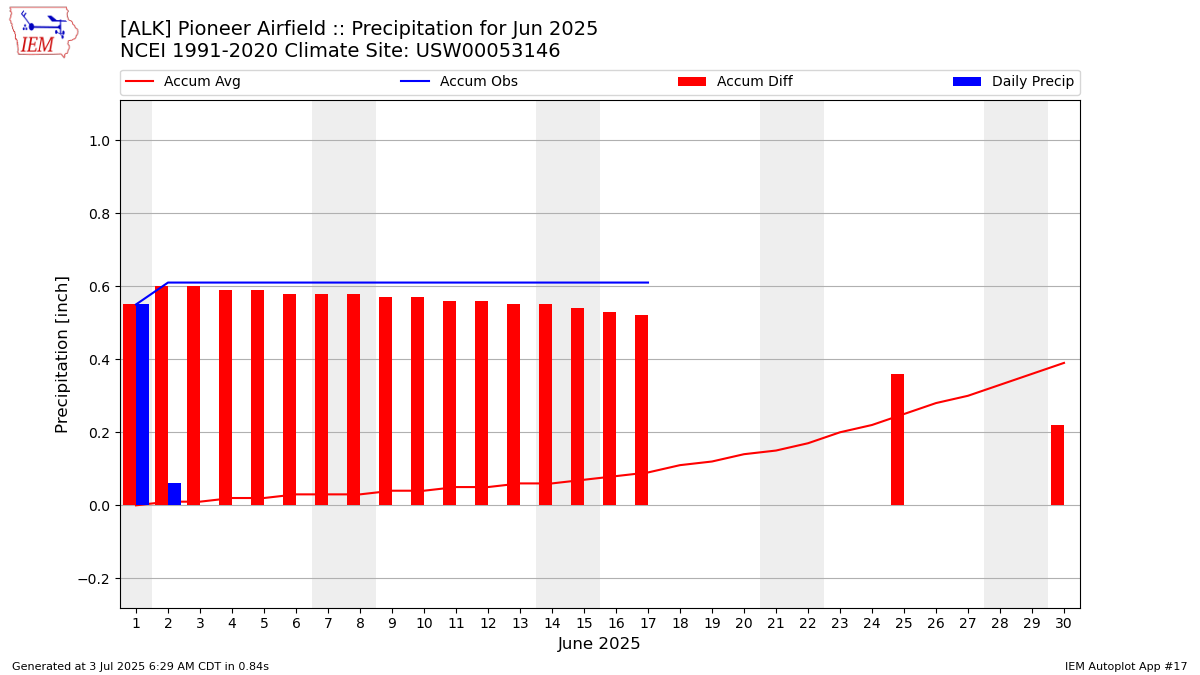
Precipitation Totals [inch]
Year
Jan
Feb
Mar
Apr
May
Jun
Jul
Aug
Sep
Oct
Nov
Dec
2008
M
M
M
M
M
M
M
1.16
0.70
0.54
0.62
0.29
2009
0.32
0.30
0.23
0.09
0.25
0.96
1.10
1.97
1.48
0.59
0.26
0.44
2010
2.29
1.55
0.49
0.61
0.00
0.06
3.61
4.34
1.65
0.18
0.03
0.42
2011
0.04
0.30
0.04
0.24
0.00
0.49
3.92
2.18
1.60
0.23
0.61
2.24
2012
0.03
0.31
0.34
0.04
0.41
0.32
5.65
4.07
1.21
0.00
0.14
0.00
2013
0.00
0.09
0.26
0.07
0.00
0.00
2.76
1.58
M
M
M
M
2014
M
M
M
0.12
0.00
0.00
3.69
3.04
5.43
0.85
0.04
0.76
2015
2.00
0.04
0.94
0.46
0.14
0.08
0.90
3.23
1.04
2.02
0.71
0.42
2016
1.51
0.33
0.17
0.13
0.00
1.27
2.06
2.60
5.47
0.03
0.12
1.26
2017
0.91
0.36
0.14
0.12
0.23
0.12
3.99
0.86
0.18
0.00
0.19
0.30
2018
0.06
2.74
0.00
0.00
0.00
0.72
5.07
4.87
1.98
2.53
0.07
1.64
2019
0.90
1.34
1.03
0.01
0.36
0.08
2.62
2.67
2.99
0.00
3.72
0.91
2020
0.55
1.15
1.77
0.00
0.07
0.16
2.43
3.84
0.02
0.00
0.16
0.38
2021
0.93
0.01
0.31
0.01
0.01
0.04
6.97
5.29
1.53
0.00
0.12
0.74
2022
0.22
0.32
0.87
0.00
0.00
1.11
4.31
5.24
1.66
2.05
0.07
2.14
2023
1.67
0.76
0.39
0.00
0.17
0.00
1.74
1.00
0.50
0.02
0.06
1.35
2024
1.56
1.71
1.17
0.34
0.00
3.60
3.36
2.10
0.65
0.02
0.40
0.00
2025
0.01
0.00
0.37
0.34
0.00
0.61
M
M
M
M
M
M
NCEI Climatology
0.86
0.96
0.71
0.20
0.20
0.39
3.63
3.55
2.06
0.79
0.64
0.99
Average Wind Speed [MPH]
Year
Jan
Feb
Mar
Apr
May
Jun
Jul
Aug
Sep
Oct
Nov
Dec
2008
M
M
M
M
M
M
M
M
7.6
8.7
8.7
10.1
2009
8.2
10.7
10.8
12.5
9.6
10.5
8.7
8.6
7.9
10.5
8.6
10.4
2010
8.0
9.3
11.6
11.1
12.0
10.5
8.5
6.9
6.9
8.7
11.2
9.9
2011
8.5
11.9
11.5
14.3
13.1
12.1
8.9
7.3
7.3
9.9
9.6
9.1
2012
9.5
9.9
10.9
10.3
12.1
10.2
8.5
7.6
7.5
8.3
7.4
9.2
2013
8.3
9.2
10.3
12.3
11.5
10.6
8.0
7.4
M
M
M
M
2014
M
M
M
10.0
11.5
12.1
8.3
7.2
7.6
7.2
10.0
8.4
2015
8.2
10.8
10.0
11.9
11.0
10.8
8.5
9.0
8.5
9.1
10.5
9.6
2016
10.1
9.8
11.1
10.8
11.1
9.8
10.0
7.7
8.9
8.8
10.4
9.2
2017
10.9
10.5
10.9
11.9
11.5
10.5
8.6
8.5
9.4
9.9
7.7
8.2
2018
9.2
10.5
10.8
11.8
11.9
10.9
9.3
8.1
7.7
10.2
9.4
9.1
2019
7.9
11.4
11.3
11.3
11.4
10.5
9.4
7.8
8.7
9.7
9.1
9.3
2020
8.4
10.6
11.5
11.3
10.2
11.5
9.2
8.8
8.7
8.7
9.8
9.9
2021
10.0
11.4
13.2
12.5
11.6
10.6
7.8
7.3
7.5
9.2
7.3
9.5
2022
9.6
11.3
10.9
13.8
12.2
10.0
8.3
7.5
8.6
8.1
10.2
8.4
2023
10.6
12.0
12.5
11.1
10.0
11.0
9.8
8.4
9.0
9.2
11.6
9.5
2024
9.8
10.0
11.8
10.8
11.1
10.3
8.7
7.7
9.2
8.3
8.6
8.4
2025
10.1
9.8
12.4
11.2
11.4
9.2
M
M
M
M
M
M
NCEI Climatology
M
M
M
M
M
M
M
M
M
M
M
M
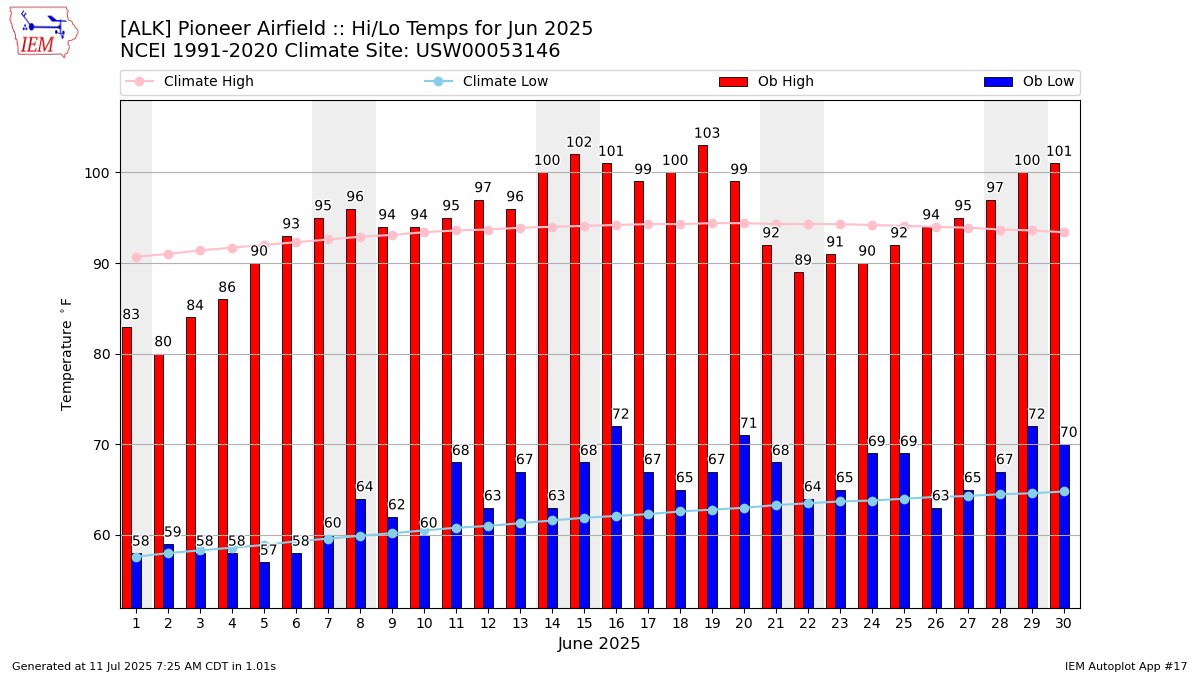
Average Daily High Temperature [F]
Year
Jan
Feb
Mar
Apr
May
Jun
Jul
Aug
Sep
Oct
Nov
Dec
2008
M
M
M
M
M
M
M
84.58
83.90
79.35
68.73
59.74
2009
62.29
65.82
70.42
73.77
84.87
87.07
91.61
90.71
85.67
74.84
69.47
56.58
2010
57.23
57.32
64.80
71.36
81.19
91.93
88.62
86.23
85.57
77.78
65.07
64.64
2011
107.34
160.58
152.82
183.07
181.58
189.17
195.43
148.52
113.95
146.90
64.77
55.23
2012
63.10
62.76
68.61
87.68
96.32
95.07
122.32
102.32
99.43
101.78
99.57
92.53
2013
55.29
57.87
95.74
104.66
83.10
127.44
86.71
129.13
M
M
M
M
2014
M
M
M
75.46
82.45
94.03
88.80
85.16
82.27
79.81
67.57
60.42
2015
59.84
68.14
70.19
74.73
79.19
93.90
87.26
90.42
85.40
77.52
68.03
60.48
2016
60.45
70.93
72.94
75.70
82.06
93.57
92.90
86.26
83.77
83.16
69.60
63.03
2017
59.32
66.71
75.65
79.13
83.06
96.43
88.48
88.26
87.13
84.00
77.50
63.97
2018
65.74
63.79
71.39
80.40
86.94
94.10
90.71
88.00
87.50
73.29
69.37
59.13
2019
60.45
57.50
69.90
76.17
77.39
91.80
92.97
91.23
85.33
78.10
68.13
58.90
2020
62.35
62.45
66.58
77.07
87.45
93.63
93.29
95.06
89.03
84.61
72.60
60.16
2021
60.58
64.96
67.29
77.53
85.71
95.83
87.39
86.87
84.97
78.90
73.43
64.10
2022
61.10
61.61
69.06
79.87
87.26
92.00
90.48
85.19
85.37
73.97
64.57
61.26
2023
57.90
59.54
66.48
78.33
82.61
91.33
98.35
93.29
91.17
82.68
70.30
63.65
2024
58.81
63.38
65.23
74.47
84.48
94.50
93.13
90.42
89.73
86.23
68.43
68.58
2025
58.71
71.71
69.45
75.97
83.58
92.33
M
M
M
M
M
M
NCEI Climatology
61.09
63.65
70.00
77.00
84.20
93.39
90.70
88.71
86.30
79.40
68.39
60.11
Average Daily Low Temperature [F]
Year
Jan
Feb
Mar
Apr
May
Jun
Jul
Aug
Sep
Oct
Nov
Dec
2008
M
M
M
M
M
M
M
62.65
57.70
49.42
41.80
35.65
2009
36.13
37.54
41.26
43.67
56.13
59.93
67.06
65.29
59.63
47.32
43.07
33.93
2010
34.48
34.58
38.10
43.07
49.48
61.70
67.26
64.19
60.30
49.71
37.64
38.52
2011
32.98
74.54
51.32
47.96
49.58
60.40
64.75
64.00
59.23
49.16
39.83
31.74
2012
37.09
35.24
37.97
47.65
55.19
63.20
64.45
64.52
59.33
50.48
44.27
34.26
2013
30.32
30.46
42.77
45.66
53.00
64.00
65.12
64.29
M
M
M
M
2014
M
M
M
45.36
52.45
64.50
65.06
62.29
60.40
51.75
40.77
35.35
2015
34.45
41.32
43.61
46.10
49.03
64.07
65.19
65.65
61.27
53.23
39.97
33.71
2016
32.71
39.17
42.06
44.63
51.26
64.87
66.84
62.23
58.00
52.97
42.03
38.58
2017
34.42
38.64
44.26
46.83
52.58
63.83
65.74
63.26
59.30
54.06
48.20
37.84
2018
37.29
39.36
41.97
49.73
54.26
63.37
67.39
64.94
61.30
49.06
39.60
36.03
2019
35.03
33.86
40.55
46.20
48.03
60.33
66.55
65.68
60.93
49.32
44.57
35.00
2020
35.68
35.69
41.68
46.27
55.35
62.63
67.55
67.19
61.37
52.29
45.03
32.19
2021
33.35
35.68
38.48
49.33
53.68
66.37
65.32
64.42
60.23
48.71
44.93
39.97
2022
34.00
32.39
38.97
48.53
54.74
64.37
65.75
64.13
60.57
48.58
36.87
36.19
2023
33.03
33.07
39.00
45.40
51.35
59.30
69.58
67.45
62.77
53.65
44.33
37.58
2024
34.45
38.41
39.77
45.10
52.06
64.97
67.23
65.45
62.03
55.26
40.97
38.97
2025
31.00
40.71
40.94
45.87
54.06
61.80
M
M
M
M
M
M
NCEI Climatology
33.70
36.04
40.00
45.00
52.40
61.70
65.50
64.20
59.49
49.89
40.90
34.21
Average Daily Temperature (high+low)/2 [F]
Year
Jan
Feb
Mar
Apr
May
Jun
Jul
Aug
Sep
Oct
Nov
Dec
2008
M
M
M
M
M
M
M
73.62
70.80
64.39
55.27
47.69
2009
49.21
51.68
55.84
58.72
70.50
73.50
79.34
78.00
72.65
61.08
56.27
45.26
2010
45.86
45.95
51.45
57.22
65.34
76.81
77.94
75.21
72.94
63.75
51.35
51.58
2011
70.16
117.56
102.07
115.51
115.58
124.79
130.09
106.26
86.59
98.03
52.30
43.48
2012
50.09
49.00
53.29
67.66
75.76
79.13
93.39
83.42
79.38
76.13
71.92
63.39
2013
42.81
44.16
69.26
75.16
68.05
95.72
75.91
96.71
M
M
M
M
2014
M
M
M
60.41
67.45
79.27
76.93
73.72
71.33
65.78
54.17
47.89
2015
47.15
54.73
56.90
60.42
64.11
78.98
76.23
78.03
73.33
65.37
54.00
47.10
2016
46.58
55.05
57.50
60.17
66.66
79.22
79.87
74.24
70.88
68.06
55.82
50.81
2017
46.87
52.68
59.95
62.98
67.82
80.13
77.11
75.76
73.22
69.03
62.85
50.90
2018
51.52
51.57
56.68
65.07
70.60
78.73
79.05
76.47
74.40
61.18
54.48
47.58
2019
47.74
45.68
55.23
61.18
62.71
76.07
79.76
78.45
73.13
63.71
56.35
46.95
2020
49.02
49.07
54.13
61.67
71.40
78.13
80.42
81.13
75.20
68.45
58.82
46.18
2021
46.97
50.32
52.89
63.43
69.69
81.10
76.35
75.65
72.60
63.80
59.18
52.03
2022
47.55
47.00
54.02
64.20
71.00
78.18
78.11
74.66
72.97
61.27
50.72
48.73
2023
45.47
46.30
52.74
61.87
66.98
75.32
83.97
80.37
76.97
68.16
57.32
50.61
2024
46.63
50.90
52.50
59.78
68.27
79.73
80.18
77.94
75.88
70.74
54.70
53.77
2025
44.85
56.21
55.19
60.92
68.82
77.07
M
M
M
M
M
M
NCEI Climatology
47.40
49.85
55.00
61.00
68.30
77.55
78.10
76.45
72.90
64.65
54.65
47.16
Average Relative Humidity [%]
This value is computed via a simple average of available observations weighted
by the duration between observations.