The following tables present IEM computed monthly data summaries based on
daily data provided by or computed for the IEM. A download interface
exists for the daily summary information. The climatology is provided by the
nearest NCEI climate station (USW00093197) within the current 1991-2020
dataset.
To load shown data into Microsoft Excel,
highlight the table information with your mouse and then copy/paste into Excel.
Precipitation Totals [inch]
Year
Jan
Feb
Mar
Apr
May
Jun
Jul
Aug
Sep
Oct
Nov
Dec
1972
M
M
M
M
M
M
M
M
M
M
M
0.00
1973
0.00
0.00
0.00
0.00
0.00
0.00
0.00
0.00
0.00
0.00
0.00
0.00
1974
0.00
0.00
0.00
0.00
0.00
0.00
0.00
0.00
0.00
0.00
0.00
0.00
1975
0.00
0.00
0.00
0.00
0.00
0.00
0.00
0.00
0.00
0.00
0.00
0.00
1976
0.00
0.00
0.00
0.00
0.00
0.00
0.00
0.00
0.00
0.00
0.00
0.00
1977
0.00
0.00
0.00
0.00
0.00
0.00
0.00
0.00
0.00
0.00
0.00
0.00
1978
0.00
0.00
0.00
0.00
0.00
0.00
0.00
0.00
0.00
0.00
0.00
0.00
1979
0.00
0.00
0.00
0.00
0.00
0.00
0.00
0.00
0.00
0.00
0.00
0.00
1980
0.00
0.00
0.00
0.00
0.00
0.00
0.00
0.00
0.00
0.00
0.00
0.00
1981
0.00
0.00
0.00
0.00
0.00
0.00
0.00
0.00
0.00
0.00
0.00
0.00
1982
0.00
0.00
0.00
0.00
0.00
0.00
0.00
0.00
0.00
0.00
0.00
0.00
1983
0.00
0.00
0.00
0.00
0.00
0.00
0.00
0.00
0.00
0.00
0.00
0.00
1984
0.00
0.00
0.00
0.00
0.00
0.00
0.00
0.00
0.00
0.00
0.00
0.00
1985
0.00
0.00
0.00
0.00
0.00
0.00
0.00
0.00
0.00
0.00
0.00
0.00
1986
0.00
0.00
0.00
0.00
0.00
0.00
0.00
0.00
0.00
0.00
0.00
0.00
1987
0.00
0.00
0.00
0.00
0.00
0.00
0.00
0.00
0.00
0.00
0.00
0.00
1988
0.00
0.00
0.00
0.00
0.00
0.00
0.00
0.00
0.00
0.00
0.00
0.00
1989
0.00
0.00
0.00
0.00
0.00
0.00
0.00
0.00
0.00
0.00
0.00
0.00
1990
0.00
0.00
0.00
0.00
0.00
0.00
0.00
0.00
0.00
0.00
0.00
0.00
1991
0.00
0.00
0.00
0.00
0.00
0.00
0.00
0.00
0.00
0.00
0.00
0.00
1992
0.00
0.00
0.00
0.00
0.00
0.00
0.00
0.00
0.00
0.00
0.00
0.00
1993
0.00
0.00
0.00
0.00
0.00
0.00
0.00
0.00
0.00
0.00
0.00
0.00
1994
0.00
0.00
0.00
0.00
0.00
0.00
0.00
0.00
0.00
0.00
0.00
0.00
1995
0.00
0.00
0.00
0.00
0.00
0.00
0.00
0.00
0.00
0.00
0.00
0.00
1996
0.00
0.00
0.00
0.00
0.00
0.00
0.00
0.00
0.00
0.00
0.00
0.00
1997
0.00
0.00
0.00
0.00
0.00
0.00
0.00
0.00
0.00
0.00
0.00
0.00
1998
0.00
0.00
0.00
0.00
0.00
0.00
0.00
0.00
0.00
0.00
0.00
0.00
1999
0.00
0.00
0.00
0.00
0.00
0.00
0.00
0.00
0.00
0.00
0.00
0.00
2000
0.00
0.00
0.00
0.00
0.00
0.00
0.00
0.00
0.00
1.67
0.04
0.10
2001
6.20
8.20
1.55
0.89
0.01
0.01
0.01
0.00
0.02
0.14
1.61
1.32
2002
0.63
0.28
0.47
0.04
0.09
0.00
1.92
0.01
0.00
0.01
0.86
1.62
2003
0.00
1.76
2.69
0.32
0.58
0.00
0.01
0.00
0.00
0.21
0.10
0.82
2004
0.54
4.93
0.70
0.05
0.00
0.00
0.00
0.00
0.04
4.13
0.41
6.14
2005
8.70
9.50
1.80
0.76
0.25
0.00
0.00
0.00
0.20
1.16
0.41
1.17
2006
1.45
2.33
2.76
2.06
0.52
0.01
0.00
0.00
0.01
0.05
0.17
0.61
2007
0.12
0.01
0.00
0.40
0.00
0.00
0.00
0.00
0.48
0.16
0.05
0.07
2008
54.63
2.00
0.02
0.06
0.15
0.00
0.01
0.01
0.03
0.07
1.39
3.37
2009
0.77
3.51
0.49
0.02
0.00
0.10
0.01
0.01
0.01
0.07
0.00
1.84
2010
5.15
5.14
0.28
1.09
0.10
0.00
0.03
0.01
0.06
1.80
0.70
9.57
2011
0.80
2.37
4.64
0.01
0.67
0.03
0.00
0.01
0.05
1.21
2.18
0.76
2012
1.27
0.14
1.18
1.43
0.04
0.02
0.02
0.00
0.01
0.07
1.57
2.93
2013
1.50
0.15
1.09
0.05
0.17
0.00
0.04
0.01
0.01
0.25
0.21
0.08
2014
0.00
3.50
0.52
0.24
0.00
0.00
0.00
0.03
0.00
0.31
0.41
3.52
2015
1.23
0.02
2.61
0.24
0.39
0.03
0.41
0.00
2.23
0.01
0.07
0.19
2016
2.32
0.61
1.93
0.23
0.12
0.00
0.00
0.00
0.00
0.38
0.90
4.10
2017
7.81
4.33
0.19
0.00
0.00
0.00
0.00
0.00
0.11
0.00
0.07
0.00
2018
1.52
0.13
4.09
0.03
0.09
0.00
0.00
0.00
0.00
0.62
1.86
2.05
2019
6.27
4.98
2.48
0.05
1.39
0.00
0.00
0.00
0.12
0.00
1.52
4.66
2020
0.49
0.12
4.60
2.18
0.15
0.00
0.00
0.00
0.00
0.00
0.06
1.29
2021
1.76
0.00
1.14
0.00
0.00
0.00
0.10
0.02
0.00
0.66
0.00
8.73
2022
0.04
0.02
1.10
0.51
0.00
0.00
0.00
0.00
0.33
0.01
1.61
2.50
2023
7.44
5.16
7.22
0.02
0.76
0.00
0.00
3.58
0.06
0.00
0.21
3.55
2024
2.00
12.30
4.55
0.57
0.06
0.00
0.00
0.00
0.00
0.00
0.07
0.01
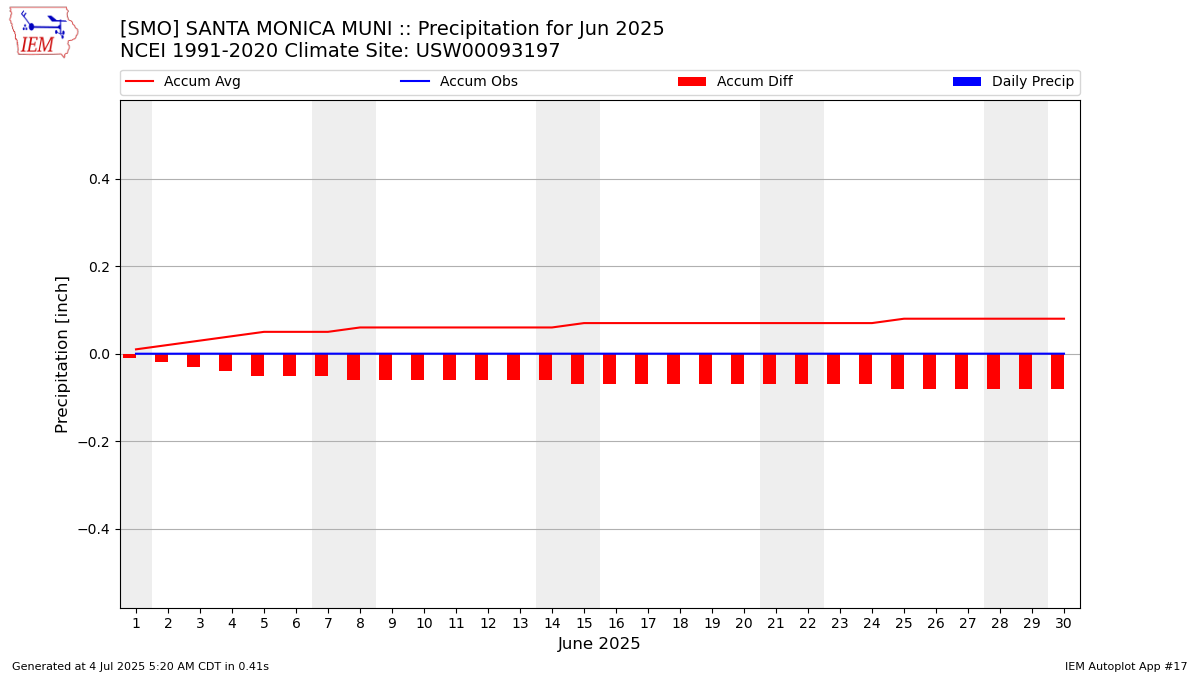
2025
1.18
3.83
1.76
0.20
0.01
0.00
M
M
M
M
M
M
NCEI Climatology
3.28
3.46
2.09
0.56
0.26
0.08
0.04
0.01
0.14
0.55
0.76
2.34
Average Wind Speed [MPH]
Year
Jan
Feb
Mar
Apr
May
Jun
Jul
Aug
Sep
Oct
Nov
Dec
1972
M
M
M
M
M
M
M
M
M
M
M
24.4
1973
9.8
9.4
10.3
10.7
8.5
7.9
8.3
8.1
7.8
7.3
8.5
7.9
1974
8.0
8.6
7.9
9.6
8.8
9.0
8.5
8.5
7.9
7.9
8.4
10.0
1975
8.8
9.7
10.9
9.8
9.4
8.7
8.5
8.2
7.8
8.7
8.5
8.4
1976
8.2
9.2
10.0
10.0
9.0
9.0
9.0
9.1
7.9
8.0
7.5
8.5
1977
8.8
8.3
11.5
9.1
9.9
9.3
8.2
7.7
8.0
6.7
8.4
7.2
1978
8.7
9.6
9.0
9.4
8.9
7.9
7.4
8.6
8.2
6.3
8.1
8.3
1979
9.4
8.5
9.2
8.9
8.7
8.5
7.9
7.3
7.3
7.4
8.1
7.9
1980
7.3
9.3
9.1
7.5
8.8
7.5
7.3
7.5
6.7
6.3
7.7
6.6
1981
7.1
7.2
8.9
8.0
7.8
8.1
7.5
6.7
6.2
6.3
7.3
6.1
1982
8.4
7.4
7.8
8.2
7.8
7.3
6.7
6.7
5.4
5.9
7.7
7.8
1983
8.1
9.3
9.0
10.4
8.0
8.5
7.7
7.7
6.9
7.1
9.1
8.2
1984
7.9
9.4
9.2
10.7
8.1
8.7
7.6
6.9
6.9
8.7
7.9
9.0
1985
8.2
8.8
10.1
8.5
8.9
8.2
8.0
7.2
8.1
7.9
8.4
8.1
1986
7.6
8.8
8.2
9.3
8.5
7.7
8.5
7.4
8.3
7.2
8.2
7.7
1987
8.5
10.0
9.6
8.5
8.8
8.3
8.2
7.9
7.8
7.9
8.6
8.6
1988
6.7
7.5
8.0
8.6
8.4
7.5
7.7
7.1
6.6
6.3
7.3
8.4
1989
8.4
8.6
7.6
8.6
7.8
8.1
7.4
7.6
7.1
7.9
7.3
7.5
1990
8.3
8.8
7.9
7.5
8.8
7.9
7.6
7.8
7.3
6.8
8.0
8.6
1991
6.7
6.9
9.0
8.9
7.1
7.2
7.0
6.5
6.1
6.2
7.5
6.8
1992
7.3
8.6
7.8
7.5
8.0
8.3
7.4
7.1
6.2
6.1
7.4
7.8
1993
7.5
8.3
6.7
7.2
8.1
7.8
8.3
7.6
6.2
5.9
7.4
6.5
1994
5.7
7.4
6.7
7.1
6.8
7.0
7.2
6.5
6.0
6.8
8.3
7.1
1995
8.6
7.1
8.5
8.9
7.1
6.7
7.0
7.2
6.1
5.8
5.3
8.0
1996
6.9
7.6
8.1
8.2
8.3
7.8
7.5
6.9
6.6
7.5
6.8
7.0
1997
6.6
8.0
6.1
8.5
7.4
8.2
7.0
6.6
5.7
6.6
6.3
8.6
1998
6.3
9.5
8.1
7.3
7.9
7.5
6.7
5.9
6.5
5.9
6.0
7.5
1999
7.1
8.3
8.0
9.0
7.9
7.5
7.4
6.6
6.3
6.0
5.9
7.1
2000
5.3
7.7
7.2
7.2
7.1
7.2
6.8
6.7
6.5
4.8
5.1
3.8
2001
4.5
5.5
4.8
5.7
5.2
5.2
5.5
4.9
4.8
4.0
4.4
5.0
2002
4.8
4.7
5.9
5.6
5.8
5.6
5.5
4.9
4.6
4.0
5.0
4.8
2003
4.5
5.7
5.7
6.4
5.7
5.4
5.4
5.0
4.5
4.0
4.3
4.6
2004
4.6
5.4
4.8
5.5
5.6
5.7
5.3
5.0
5.0
4.9
4.8
4.7
2005
5.1
5.5
5.3
5.9
5.5
5.6
5.4
5.2
4.6
4.0
4.3
4.1
2006
5.4
4.7
5.4
5.4
5.4
5.3
4.7
4.4
4.1
4.4
3.6
4.9
2007
5.2
5.4
5.4
5.1
5.2
4.5
4.4
4.2
4.2
3.7
3.1
4.2
2008
4.9
4.2
4.6
4.7
4.8
4.6
4.6
4.3
3.8
3.9
3.4
3.6
2009
3.3
4.1
4.3
4.9
4.9
4.9
4.6
4.1
3.8
4.2
3.3
3.6
2010
3.9
4.0
4.4
5.5
4.9
4.7
4.8
4.3
3.7
3.7
5.5
5.1
2011
3.8
4.2
4.2
5.2
5.3
4.6
4.9
4.1
3.9
3.5
3.7
3.4
2012
3.3
4.0
4.7
4.9
4.6
4.8
4.4
4.2
3.6
3.8
3.2
3.4
2013
4.1
4.2
3.9
5.1
5.0
4.8
4.3
4.1
4.0
3.6
3.3
3.6
2014
3.1
3.8
4.2
4.8
5.3
4.9
4.8
4.5
4.6
4.0
4.4
4.2
2015
3.6
4.1
4.7
5.3
5.3
5.0
5.4
4.7
4.5
4.6
5.0
4.9
2016
4.0
4.4
5.3
5.4
5.5
5.0
5.3
5.0
4.8
4.1
4.3
4.3
2017
4.6
4.1
4.9
5.8
5.4
5.1
5.1
5.0
4.7
4.0
3.5
4.1
2018
3.9
4.6
4.8
5.3
5.2
5.2
5.2
4.8
4.4
4.2
3.8
4.2
2019
4.4
5.5
4.8
5.0
5.1
4.8
4.6
4.3
4.1
3.9
3.6
4.1
2020
3.9
4.6
4.6
4.8
4.9
5.3
4.6
4.3
3.5
3.3
3.5
3.9
2021
3.7
4.4
4.7
4.8
5.0
4.9
4.8
4.4
4.0
3.9
3.1
3.4
2022
3.4
4.3
4.6
5.4
5.1
5.1
5.0
4.5
4.4
4.0
4.3
3.3
2023
4.8
5.3
5.3
4.7
5.0
5.0
4.7
4.9
4.3
3.9
4.0
3.6
2024
4.1
4.2
4.9
5.0
5.1
4.7
4.7
4.5
4.1
3.6
4.0
2.8
2025
4.3
4.3
5.1
5.1
4.9
5.0
M
M
M
M
M
M
NCEI Climatology
M
M
M
M
M
M
M
M
M
M
M
M
Average Daily High Temperature [F]
Year
Jan
Feb
Mar
Apr
May
Jun
Jul
Aug
Sep
Oct
Nov
Dec
1972
M
M
M
M
M
M
M
M
M
M
M
M
1973
M
30.33
M
33.00
M
M
M
M
M
-6.00
58.00
M
1974
31.00
M
53.00
38.50
36.50
6.00
M
M
67.00
81.00
M
33.00
1975
46.50
53.00
47.00
M
M
56.00
M
32.67
M
M
52.00
50.00
1976
45.75
53.60
23.00
53.25
M
24.00
21.00
M
46.00
M
M
M
1977
M
M
28.00
M
M
M
M
M
36.00
M
M
M
1978
57.00
M
36.00
24.00
M
M
M
M
67.00
27.00
M
52.00
1979
33.50
35.00
62.00
63.50
43.00
M
M
M
M
M
M
M
1980
35.00
M
35.00
M
59.67
61.00
M
100.00
M
64.00
49.00
59.50
1981
M
M
M
M
M
M
85.00
M
77.00
M
M
M
1982
M
M
68.00
M
M
M
75.00
M
73.00
58.25
68.23
62.90
1983
67.11
65.90
64.29
65.13
67.71
69.33
75.03
79.13
78.03
75.94
67.83
65.60
1984
69.29
66.24
68.19
68.07
71.77
71.12
76.55
77.84
82.27
71.68
64.57
61.19
1985
62.55
64.32
62.13
67.10
66.13
71.13
77.16
75.68
74.57
73.58
64.87
67.13
1986
69.55
65.79
65.74
68.27
69.10
71.07
72.84
74.03
70.30
72.55
72.43
66.32
1987
62.48
65.29
65.06
68.70
68.67
69.00
71.32
72.68
75.10
74.35
69.03
60.06
1988
64.61
69.07
69.84
67.10
68.58
68.43
73.55
73.03
72.97
70.81
65.80
63.10
1989
64.10
60.64
65.29
71.17
67.58
69.97
74.61
72.52
74.03
71.35
72.73
70.10
1990
65.68
62.11
63.81
67.77
69.19
74.47
77.45
75.16
78.37
77.94
73.67
65.06
1991
63.87
65.82
61.08
67.20
66.10
68.00
70.61
73.58
73.20
73.39
68.87
61.87
1992
68.76
72.21
67.48
75.97
75.87
74.93
79.61
80.77
77.23
72.81
75.60
64.13
1993
63.04
64.36
69.06
71.60
72.39
74.50
76.10
75.68
75.27
75.32
71.73
68.19
1994
67.71
65.11
68.81
67.83
68.13
75.57
74.42
81.39
77.20
73.65
66.33
64.65
1995
62.55
69.00
66.94
68.33
65.90
70.10
74.10
74.74
76.83
73.00
68.77
66.00
1996
65.84
64.59
66.39
72.23
72.37
73.86
74.41
77.44
75.57
71.35
71.87
65.34
1997
63.88
67.50
68.77
70.08
74.43
74.17
75.49
79.86
81.16
77.04
70.97
67.06
1998
64.59
63.14
66.71
65.45
68.16
70.91
75.29
79.43
77.17
73.34
67.73
65.81
1999
66.50
64.83
61.62
65.97
68.85
71.85
77.16
75.10
73.66
80.97
72.60
71.61
2000
69.01
67.75
69.14
72.13
75.87
78.34
79.74
81.39
78.07
69.10
65.87
66.16
2001
63.24
60.72
62.68
63.61
68.58
72.24
72.15
73.09
72.85
69.71
66.39
63.01
2002
63.03
68.01
64.82
63.74
67.34
70.14
72.90
73.10
74.71
67.75
73.32
63.95
2003
71.91
65.68
67.48
65.41
67.08
69.47
77.87
78.04
73.05
74.81
68.20
65.14
2004
63.74
62.59
67.49
68.14
72.06
69.83
73.41
72.67
77.80
68.11
66.09
66.19
2005
65.35
65.90
66.01
68.26
70.86
70.71
74.46
74.35
73.54
72.02
72.44
67.54
2006
68.06
67.57
61.33
65.82
69.21
74.45
78.83
74.58
73.27
71.54
70.85
66.02
2007
64.68
65.93
68.29
65.97
69.81
71.30
75.45
77.19
74.43
74.10
67.07
62.77
2008
62.20
64.06
67.55
69.68
69.44
74.06
75.47
77.29
75.32
78.70
72.61
62.50
2009
70.91
65.27
65.53
68.61
70.20
70.27
74.70
76.15
78.99
74.24
70.79
64.24
2010
67.58
65.50
68.66
65.55
66.69
69.64
70.86
71.67
72.67
70.89
69.79
64.44
2011
68.25
62.93
65.14
68.47
68.93
69.17
73.81
73.75
72.74
71.52
67.87
64.32
2012
69.48
65.54
64.56
67.93
68.74
70.20
72.00
78.81
79.83
76.94
69.97
62.55
2013
66.38
64.73
65.58
68.53
72.20
72.63
74.05
74.32
76.90
73.00
72.73
69.65
2014
71.90
67.04
71.35
72.13
77.90
74.23
78.67
77.87
80.47
78.65
75.27
66.81
2015
71.19
70.92
75.19
71.87
68.00
72.05
75.13
79.48
81.83
81.13
71.73
66.45
2016
64.36
73.89
67.65
71.00
67.93
74.19
77.42
76.39
77.49
74.94
73.90
65.72
2017
62.56
62.39
69.00
71.03
68.39
72.17
76.75
76.75
77.97
78.97
72.57
71.13
2018
70.35
66.21
64.55
67.45
66.81
70.53
78.52
81.26
77.53
77.57
76.13
69.55
2019
68.16
61.06
66.67
68.50
65.96
70.37
74.87
75.71
78.07
78.00
69.40
64.29
2020
65.74
66.59
63.39
67.24
71.29
73.43
73.32
77.65
78.67
77.35
69.03
68.90
2021
67.39
66.79
65.10
68.13
67.55
70.92
74.52
75.52
73.87
72.82
70.07
60.79
2022
67.95
69.36
68.52
69.83
68.28
72.73
74.05
77.55
82.13
73.88
68.83
63.58
2023
61.93
62.57
60.90
64.61
64.65
67.93
74.94
76.23
75.00
74.65
73.53
68.45
2024
64.52
62.52
65.03
66.67
67.23
72.13
75.10
77.55
76.03
72.71
69.87
64.71
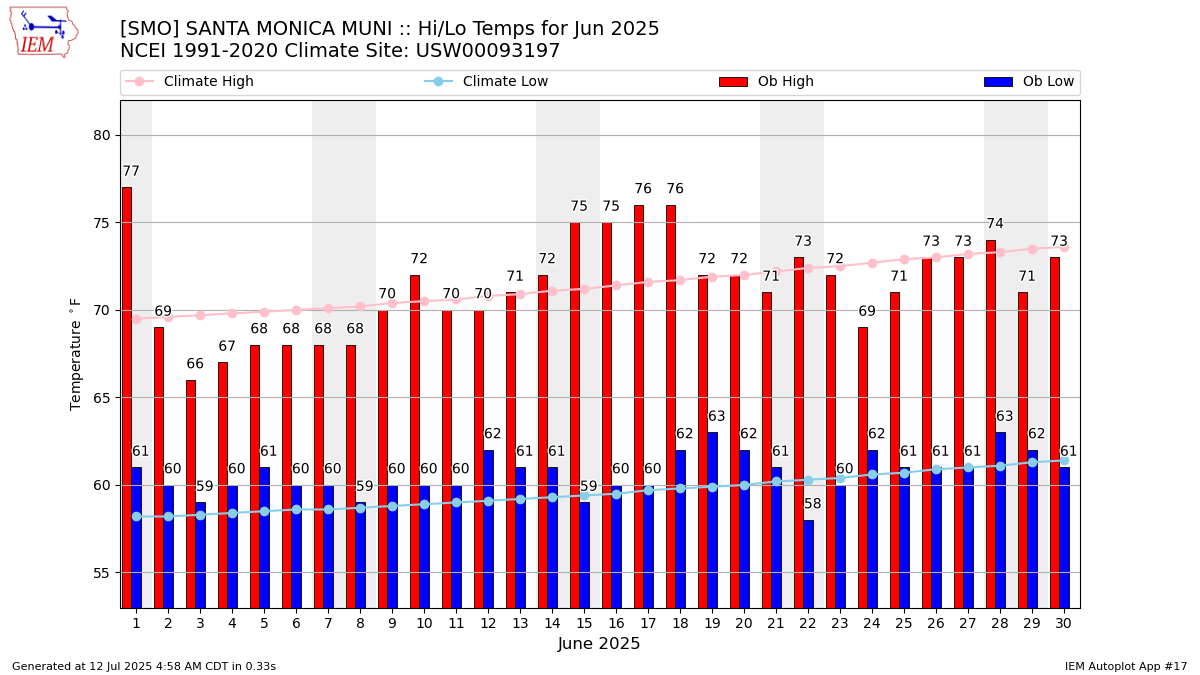
2025
65.26
64.46
63.23
65.73
69.39
71.00
M
M
M
M
M
M
NCEI Climatology
66.00
65.60
66.41
68.10
68.90
71.41
75.10
76.50
76.10
74.01
70.11
66.21
Average Daily Low Temperature [F]
Year
Jan
Feb
Mar
Apr
May
Jun
Jul
Aug
Sep
Oct
Nov
Dec
1972
M
M
M
M
M
M
M
M
M
M
M
M
1973
M
30.33
M
33.00
M
M
M
M
M
-6.00
58.00
M
1974
31.00
M
53.00
38.50
36.50
6.00
M
M
67.00
81.00
M
33.00
1975
42.50
53.00
47.00
M
M
56.00
M
32.67
M
M
52.00
50.00
1976
45.75
49.00
23.00
53.25
M
24.00
21.00
M
46.00
M
M
M
1977
M
M
28.00
M
M
M
M
M
36.00
M
M
M
1978
57.00
M
36.00
24.00
M
M
M
M
67.00
23.00
M
52.00
1979
33.50
35.00
62.00
63.50
43.00
M
M
M
M
M
M
M
1980
35.00
M
35.00
M
59.67
61.00
M
100.00
M
64.00
49.00
59.50
1981
M
M
M
M
M
M
85.00
M
77.00
M
M
M
1982
M
M
68.00
M
M
M
75.00
M
73.00
52.00
54.40
47.97
1983
51.86
52.95
53.58
54.90
57.94
61.27
64.48
67.48
67.69
63.42
55.57
51.80
1984
52.50
50.72
56.00
57.30
58.68
62.04
66.23
67.84
69.33
59.03
52.57
49.19
1985
48.81
50.25
50.94
55.70
56.23
61.47
65.87
63.87
62.53
60.55
52.97
49.23
1986
55.13
53.14
54.29
57.07
58.00
61.17
63.32
62.39
60.17
58.97
56.37
50.97
1987
47.74
52.21
54.10
56.50
58.75
60.83
61.68
62.55
63.57
63.16
55.57
47.29
1988
49.77
52.17
56.13
54.83
57.26
59.00
65.13
63.45
61.20
60.52
53.17
49.32
1989
47.03
47.39
53.19
58.73
57.90
61.20
64.10
62.74
61.07
59.10
56.73
51.13
1990
49.61
47.75
51.77
56.43
58.10
61.77
66.16
64.23
63.63
59.87
55.07
48.61
1991
49.97
52.21
50.04
55.60
55.45
59.50
62.55
64.03
64.30
60.71
52.27
45.55
1992
47.66
55.59
54.23
59.37
65.39
62.83
66.00
68.73
66.63
62.04
58.47
49.87
1993
50.04
50.96
55.42
57.67
60.68
64.17
66.77
65.10
63.23
61.10
55.43
50.23
1994
50.52
49.46
55.42
55.83
57.81
63.33
63.39
67.45
63.63
59.19
50.10
50.16
1995
51.74
55.39
55.65
55.53
56.65
59.97
63.16
64.16
63.23
60.55
56.40
52.58
1996
51.32
53.52
54.23
57.93
60.70
62.38
63.10
64.66
64.00
59.59
56.48
52.12
1997
52.07
51.54
53.68
56.40
63.36
64.98
64.90
67.16
67.49
60.60
56.47
50.39
1998
50.97
50.57
53.77
51.90
57.02
60.90
64.71
66.83
66.97
58.19
51.90
48.84
1999
48.81
50.76
51.62
52.10
57.61
60.10
63.52
61.68
60.09
60.55
56.32
51.19
2000
52.77
54.12
54.68
57.61
62.57
67.00
67.13
67.10
62.90
56.76
48.20
48.35
2001
45.62
46.36
52.19
49.99
57.83
60.22
61.06
61.46
60.47
58.05
52.38
46.88
2002
45.90
47.05
48.85
52.02
54.90
59.60
62.06
60.78
60.20
56.26
54.19
47.48
2003
52.34
49.80
51.05
50.45
54.65
60.30
65.26
63.47
61.92
60.02
50.43
48.44
2004
49.06
47.79
53.87
54.73
58.26
61.03
62.32
62.68
63.25
56.47
49.69
48.28
2005
49.93
51.11
52.18
52.43
57.19
58.35
62.72
63.35
59.30
56.86
54.16
50.99
2006
50.00
50.15
48.26
53.20
59.99
62.54
66.76
63.26
60.85
56.90
53.59
47.13
2007
45.35
48.29
52.52
52.81
57.30
60.07
63.26
63.77
59.70
55.58
52.88
45.45
2008
46.50
46.71
49.89
52.14
55.18
60.72
64.29
66.05
62.47
57.45
55.05
47.35
2009
49.73
47.96
50.38
51.72
58.11
59.81
62.13
61.72
63.73
56.84
51.05
47.48
2010
49.72
49.22
50.77
50.86
53.35
59.12
60.35
58.61
57.80
58.29
50.08
49.06
2011
47.73
44.40
49.14
53.46
53.90
57.45
62.16
61.13
60.61
56.22
50.67
43.77
2012
47.71
47.51
48.68
51.93
56.23
59.47
60.42
64.94
63.70
59.83
53.43
48.88
2013
45.84
45.87
51.13
54.90
59.32
62.13
63.12
62.22
62.40
56.28
54.30
48.29
2014
50.58
51.51
56.06
56.67
62.52
63.36
67.16
65.21
66.51
62.13
56.27
51.70
2015
51.61
54.09
57.07
55.57
56.39
59.40
63.32
66.52
67.85
65.65
51.50
47.55
2016
49.35
52.31
53.65
56.17
57.25
61.43
65.53
64.42
63.29
59.29
54.25
49.75
2017
47.68
51.05
52.19
55.28
56.10
60.40
65.16
65.98
63.86
61.43
55.57
49.03
2018
51.39
48.07
50.26
53.10
55.91
59.85
67.04
68.52
66.00
62.53
56.97
52.94
2019
51.81
47.29
51.76
55.55
55.82
60.95
63.50
63.77
63.99
56.94
51.63
48.62
2020
48.23
49.34
49.85
54.17
57.52
61.19
60.65
64.28
62.53
60.41
49.74
47.45
2021
47.84
49.00
47.57
52.93
56.96
60.53
64.12
63.08
60.71
55.42
53.25
46.54
2022
48.48
48.07
51.23
54.33
56.17
61.03
62.76
64.79
66.97
60.59
48.77
48.00
2023
46.45
45.36
48.06
51.35
55.26
57.73
62.27
63.52
62.65
57.48
53.11
51.23
2024
48.55
49.55
50.52
52.12
56.94
60.77
63.03
64.26
63.63
58.61
50.60
48.32
2025
45.71
49.39
49.45
52.47
57.77
60.28
M
M
M
M
M
M
NCEI Climatology
48.71
49.03
51.00
52.80
56.61
59.60
62.90
63.19
62.31
58.10
51.99
47.70
Average Daily Temperature (high+low)/2 [F]
Year
Jan
Feb
Mar
Apr
May
Jun
Jul
Aug
Sep
Oct
Nov
Dec
1972
M
M
M
M
M
M
M
M
M
M
M
M
1973
M
30.33
M
33.00
M
M
M
M
M
-6.00
58.00
M
1974
31.00
M
53.00
38.50
36.50
6.00
M
M
67.00
81.00
M
33.00
1975
44.50
53.00
47.00
M
M
56.00
M
32.67
M
M
52.00
50.00
1976
45.75
51.30
23.00
53.25
M
24.00
21.00
M
46.00
M
M
M
1977
M
M
28.00
M
M
M
M
M
36.00
M
M
M
1978
57.00
M
36.00
24.00
M
M
M
M
67.00
25.00
M
52.00
1979
33.50
35.00
62.00
63.50
43.00
M
M
M
M
M
M
M
1980
35.00
M
35.00
M
59.67
61.00
M
100.00
M
64.00
49.00
59.50
1981
M
M
M
M
M
M
85.00
M
77.00
M
M
M
1982
M
M
68.00
M
M
M
75.00
M
73.00
55.12
61.32
55.44
1983
59.48
59.43
58.94
60.02
62.82
65.30
69.76
73.31
72.86
69.68
61.70
58.70
1984
60.89
58.48
62.10
62.68
65.23
66.58
71.39
72.84
75.80
65.35
58.57
55.19
1985
55.68
57.29
56.53
61.40
61.18
66.30
71.52
69.77
68.55
67.06
58.92
58.18
1986
62.34
59.46
60.02
62.67
63.55
66.12
68.08
68.21
65.23
65.76
64.40
58.65
1987
55.11
58.75
59.58
62.60
63.71
64.92
66.50
67.61
69.33
68.76
62.30
53.68
1988
57.19
60.62
62.98
60.97
62.92
63.72
69.34
68.24
67.08
65.66
59.48
56.21
1989
55.56
54.02
59.24
64.95
62.74
65.58
69.35
67.63
67.55
65.23
64.73
60.61
1990
57.65
54.93
57.79
62.10
63.65
68.12
71.81
69.69
71.00
68.90
64.37
56.84
1991
56.92
59.02
55.56
61.40
60.77
63.75
66.58
68.81
68.75
67.05
60.57
53.71
1992
58.21
63.90
60.85
67.67
70.63
68.88
72.81
74.75
71.93
67.43
67.03
57.00
1993
56.54
57.66
62.24
64.63
66.53
69.33
71.44
70.39
69.25
68.21
63.58
59.21
1994
59.11
57.29
62.11
61.83
62.97
69.45
68.90
74.42
70.42
66.42
58.22
57.40
1995
57.15
62.20
61.29
61.93
61.27
65.03
68.63
69.45
70.03
66.77
62.58
59.29
1996
58.58
59.05
60.31
65.08
66.53
68.12
68.76
71.05
69.79
65.47
64.17
58.73
1997
57.97
59.52
61.23
63.24
68.90
69.57
70.20
73.51
74.32
68.82
63.72
58.73
1998
57.78
56.86
60.24
58.67
62.59
65.91
70.00
73.13
72.07
65.77
59.81
57.32
1999
57.65
57.79
56.62
59.03
63.23
65.97
70.34
68.39
66.87
70.76
64.46
61.40
2000
60.89
60.94
61.91
64.87
69.22
72.67
73.44
74.24
70.48
62.93
57.03
57.26
2001
54.43
53.54
57.44
56.80
63.20
66.23
66.60
67.28
66.66
63.88
59.39
54.95
2002
54.46
57.53
56.83
57.88
61.12
64.87
67.48
66.94
67.46
62.01
63.76
55.71
2003
62.12
57.74
59.26
57.93
60.87
64.89
71.56
70.76
67.49
67.41
59.31
56.79
2004
56.40
55.19
60.68
61.44
65.16
65.43
67.87
67.68
70.53
62.29
57.89
57.24
2005
57.64
58.50
59.10
60.35
64.02
64.53
68.59
68.85
66.42
64.44
63.30
59.26
2006
59.03
58.86
54.80
59.51
64.60
68.49
72.80
68.92
67.06
64.22
62.22
56.57
2007
55.02
57.11
60.40
59.39
63.55
65.68
69.35
70.48
67.07
64.84
59.97
54.11
2008
54.35
55.39
58.72
60.91
62.31
67.39
69.88
71.67
68.89
68.08
63.83
54.92
2009
60.32
56.62
57.96
60.17
64.16
65.04
68.42
68.93
71.36
65.54
60.92
55.86
2010
58.65
57.36
59.72
58.20
60.02
64.38
65.60
65.14
65.24
64.59
59.94
56.75
2011
57.99
53.67
57.14
60.96
61.42
63.31
67.99
67.44
66.67
63.87
59.27
54.05
2012
58.60
56.53
56.62
59.93
62.49
64.83
66.21
71.87
71.77
68.38
61.70
55.71
2013
56.11
55.30
58.35
61.72
65.76
67.38
68.58
68.27
69.65
64.64
63.52
58.97
2014
61.24
59.28
63.71
64.40
70.21
68.80
72.92
71.54
73.49
70.39
65.77
59.26
2015
61.40
62.50
66.13
63.72
62.19
65.72
69.23
73.00
74.84
73.39
61.62
57.00
2016
56.86
63.10
60.65
63.58
62.59
67.81
71.47
70.40
70.39
67.11
64.08
57.73
2017
55.12
56.72
60.60
63.16
62.25
66.28
70.96
71.36
70.91
70.20
64.07
60.08
2018
60.87
57.14
57.40
60.28
61.36
65.19
72.78
74.89
71.77
70.05
66.55
61.24
2019
59.99
54.17
59.22
62.02
60.89
65.66
69.18
69.74
71.03
67.47
60.52
56.45
2020
56.99
57.97
56.62
60.71
64.41
67.31
66.98
70.96
70.60
68.88
59.39
58.18
2021
57.61
57.89
56.33
60.53
62.26
65.73
69.32
69.30
67.29
64.12
61.66
53.67
2022
58.22
58.71
59.87
62.08
62.23
66.88
68.41
71.17
74.55
67.24
58.80
55.79
2023
54.19
53.96
54.48
57.98
59.95
62.83
68.60
69.87
68.83
66.06
63.32
59.84
2024
56.53
56.04
57.77
59.39
62.08
66.45
69.06
70.90
69.83
65.66
60.23
56.52
2025
55.48
56.93
56.34
59.10
63.58
65.64
M
M
M
M
M
M
NCEI Climatology
57.35
57.32
58.70
60.45
62.75
65.50
69.00
69.85
69.20
66.05
61.05
56.95
Average Relative Humidity [%]
This value is computed via a simple average of available observations weighted
by the duration between observations.