The following tables present IEM computed monthly data summaries based on
daily data provided by or computed for the IEM. A download interface
exists for the daily summary information. The climatology is provided by the
nearest NCEI climate station (USC00040931) within the current 1991-2020
dataset.
To load shown data into Microsoft Excel,
highlight the table information with your mouse and then copy/paste into Excel.
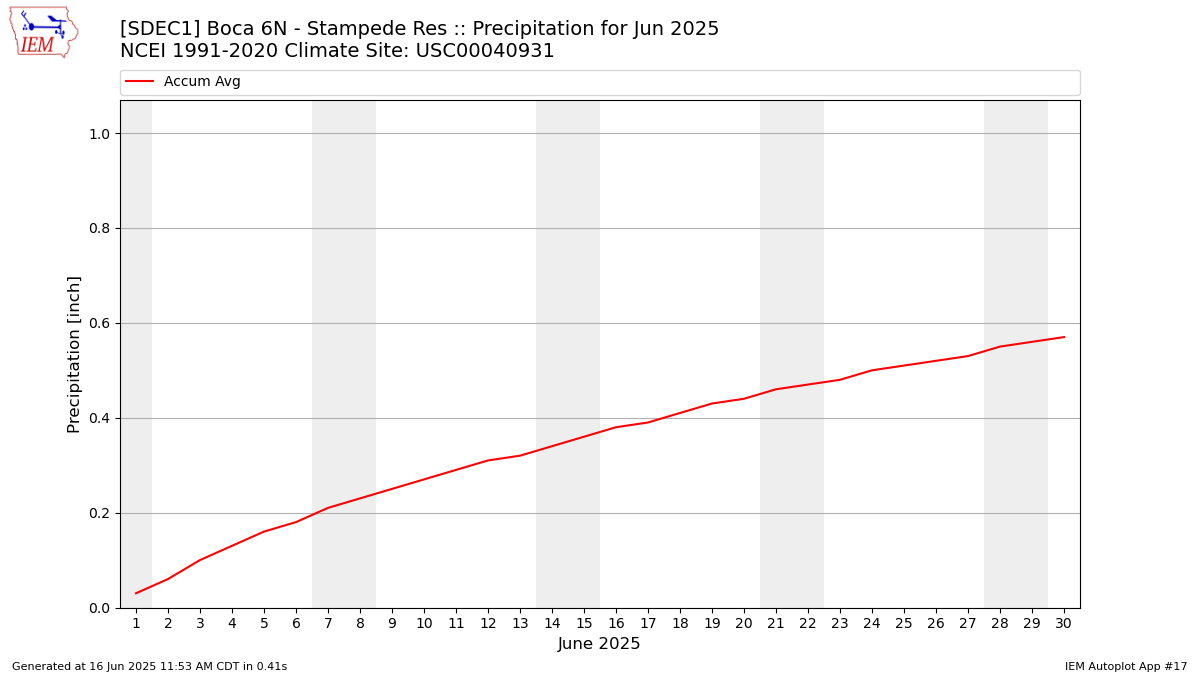
Precipitation Totals [inch]
Year
Jan
Feb
Mar
Apr
May
Jun
Jul
Aug
Sep
Oct
Nov
Dec
2024
M
M
M
M
M
M
M
M
M
M
M
M
2025
M
M
M
M
M
M
M
M
M
M
M
M
NCEI Climatology
3.91
3.73
2.93
1.47
1.35
0.57
0.48
0.36
0.48
1.26
2.00
4.12
Average Wind Speed [MPH]
Year
Jan
Feb
Mar
Apr
May
Jun
Jul
Aug
Sep
Oct
Nov
Dec
2024
M
M
M
M
M
M
M
M
M
M
M
M
2025
M
M
M
M
M
M
M
M
M
M
M
M
NCEI Climatology
M
M
M
M
M
M
M
M
M
M
M
M
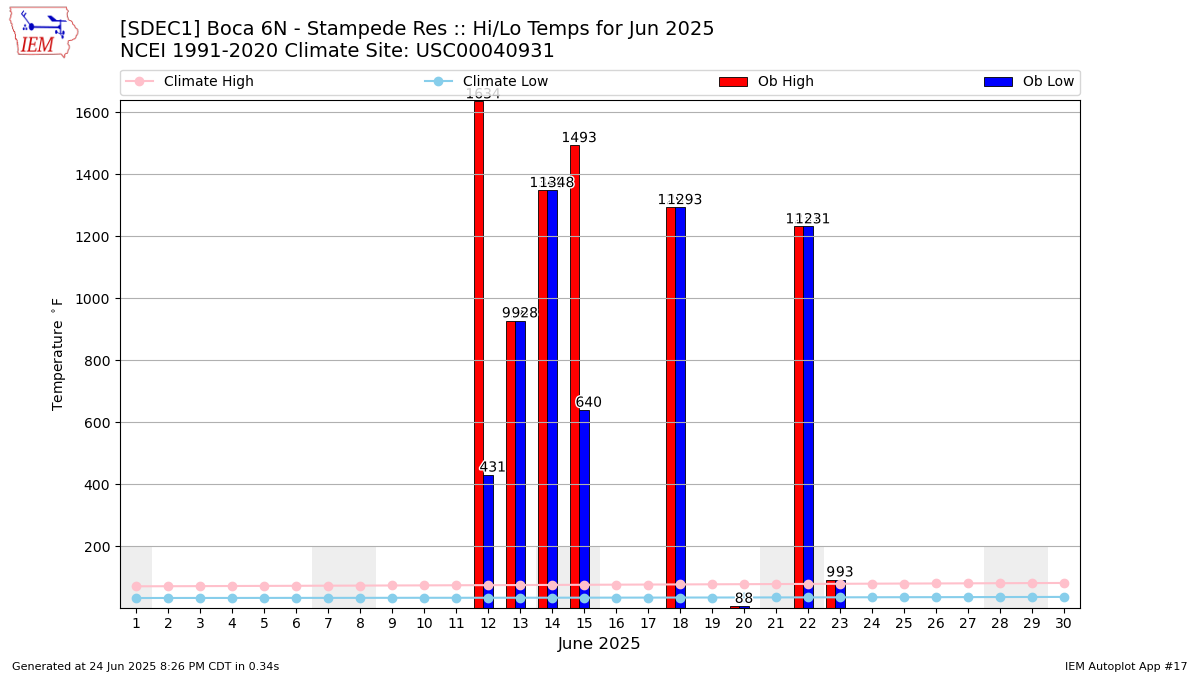
Average Daily High Temperature [F]
Year
Jan
Feb
Mar
Apr
May
Jun
Jul
Aug
Sep
Oct
Nov
Dec
2024
M
M
710.29
1204.29
1162.44
669.38
966.06
966.50
967.86
806.47
958.26
1156.57
2025
936.12
1157.24
841.85
757.73
884.62
1303.33
M
M
M
M
M
M
NCEI Climatology
43.59
46.27
51.70
57.90
66.50
76.52
85.80
85.11
78.69
67.20
53.71
42.91
Average Daily Low Temperature [F]
Year
Jan
Feb
Mar
Apr
May
Jun
Jul
Aug
Sep
Oct
Nov
Dec
2024
M
M
620.14
968.00
931.78
476.38
594.44
775.19
867.64
530.33
691.32
703.93
2025
876.94
757.59
749.46
510.40
792.50
902.33
M
M
M
M
M
M
NCEI Climatology
13.30
15.49
20.70
25.01
31.30
34.99
39.40
36.80
31.19
24.79
19.80
14.99
Average Daily Temperature (high+low)/2 [F]
Year
Jan
Feb
Mar
Apr
May
Jun
Jul
Aug
Sep
Oct
Nov
Dec
2024
M
M
665.21
1086.15
1047.11
572.88
780.25
870.84
917.75
668.40
824.79
930.25
2025
906.53
957.41
795.65
634.07
838.56
1102.83
M
M
M
M
M
M
NCEI Climatology
28.45
30.88
36.20
41.46
48.90
55.75
62.60
60.95
54.94
46.00
36.75
28.95
Average Relative Humidity [%]
This value is computed via a simple average of available observations weighted
by the duration between observations.