The following tables present IEM computed monthly data summaries based on
daily data provided by or computed for the IEM. A download interface
exists for the daily summary information. The climatology is provided by the
nearest NCEI climate station () within the current 1991-2020
dataset.
To load shown data into Microsoft Excel,
highlight the table information with your mouse and then copy/paste into Excel.
Precipitation Totals [inch]
Year
Jan
Feb
Mar
Apr
May
Jun
Jul
Aug
Sep
Oct
Nov
Dec
2001
M
M
M
0.00
0.00
0.00
0.00
0.00
0.00
0.00
0.00
0.00
2002
0.00
0.00
0.00
0.00
0.00
0.00
0.00
0.00
0.00
0.00
0.00
0.00
2003
M
M
M
M
M
M
M
M
M
M
M
M
2004
M
M
M
M
M
M
M
M
M
M
M
M
2005
M
M
M
M
M
M
M
M
M
M
M
M
2006
M
M
M
M
M
M
M
M
M
M
M
M
2007
M
0.00
M
M
M
M
M
M
M
M
M
M
2008
M
M
M
M
M
M
M
M
M
M
M
M
2009
M
M
M
M
M
M
M
M
M
M
M
M
2010
M
M
M
M
M
M
M
M
M
M
M
M
2011
M
M
M
M
M
M
M
0.00
0.00
0.00
0.00
0.00
2012
0.00
0.00
0.00
0.00
0.00
0.00
0.00
0.00
0.00
0.00
0.00
0.00
2013
0.00
0.00
0.00
0.00
0.00
0.00
0.00
0.00
0.00
M
M
M
2014
M
M
M
M
M
M
M
M
M
M
M
M
2015
M
M
M
M
M
M
M
M
M
M
M
M
2016
M
M
M
M
M
0.00
0.00
M
M
M
M
M
2017
M
M
M
M
M
M
0.00
M
M
M
M
M
2018
M
M
M
M
M
M
M
M
M
M
M
M
2019
M
M
M
M
M
M
M
M
M
M
M
M
2020
M
M
M
M
M
M
M
M
M
M
M
M
2021
M
M
M
M
M
M
M
M
M
M
M
M
2022
M
M
M
M
M
M
M
M
M
M
M
M
2023
M
M
M
M
M
M
M
M
M
M
M
M
2024
M
M
M
M
M
M
M
M
M
M
M
M
2025
M
M
M
M
M
M
M
M
M
M
M
M
Average Wind Speed [MPH]
Year
Jan
Feb
Mar
Apr
May
Jun
Jul
Aug
Sep
Oct
Nov
Dec
2001
M
M
M
9.0
6.8
6.9
5.9
6.6
5.6
9.4
6.4
5.1
2002
5.4
7.5
8.1
7.8
7.2
4.0
4.4
3.7
6.9
3.9
4.6
4.7
2003
M
M
M
M
M
M
M
M
M
M
M
M
2004
M
M
M
M
6.5
7.8
3.6
3.2
2.4
3.8
5.3
5.7
2005
5.0
6.6
9.3
5.4
2.4
5.3
4.5
4.0
4.1
5.2
4.9
4.5
2006
5.7
6.9
8.3
7.7
6.9
3.9
4.9
3.8
3.0
4.7
4.0
5.0
2007
5.6
6.6
11.9
9.7
7.6
7.6
7.9
4.9
4.6
6.5
8.7
7.3
2008
7.7
10.7
12.8
9.8
11.9
7.4
7.5
5.5
6.2
8.1
8.1
9.0
2009
M
M
M
M
M
M
M
M
M
M
M
M
2010
M
M
M
M
M
M
M
M
M
M
M
M
2011
M
M
M
M
M
M
12.2
2.2
4.8
5.9
6.7
6.8
2012
7.7
6.4
10.6
7.8
6.1
7.1
5.1
6.9
4.1
4.0
7.4
5.3
2013
7.9
10.5
11.5
9.8
10.4
4.5
4.2
3.3
3.9
2.5
5.8
6.0
2014
5.6
5.4
9.3
11.4
10.1
8.7
6.7
4.9
6.6
6.1
9.0
7.3
2015
8.4
9.2
10.6
10.2
10.2
8.9
9.7
8.3
5.9
5.2
8.5
9.0
2016
6.1
5.3
11.8
10.4
10.4
9.0
6.7
8.8
6.2
5.3
9.5
9.8
2017
9.1
10.7
11.1
10.1
9.7
8.7
5.4
7.1
4.4
4.7
4.7
3.6
2018
4.0
5.3
8.2
8.2
5.8
8.9
4.2
7.1
6.4
6.8
6.3
7.5
2019
7.1
8.4
8.3
9.4
9.3
9.8
6.6
7.9
5.6
5.8
7.6
5.5
2020
8.0
9.2
10.2
9.5
M
M
M
M
M
M
M
M
2021
M
M
M
M
M
M
M
M
M
M
M
M
2022
M
M
M
7.6
6.7
5.1
4.0
3.0
3.3
3.2
3.6
7.8
2023
6.9
7.6
8.5
9.2
7.2
7.8
5.8
4.6
2.3
5.2
5.2
4.3
2024
5.3
6.4
8.9
10.3
12.7
8.0
6.0
2.0
3.3
4.5
2.7
3.4
2025
3.8
5.0
6.0
8.9
10.0
7.8
M
M
M
M
M
M
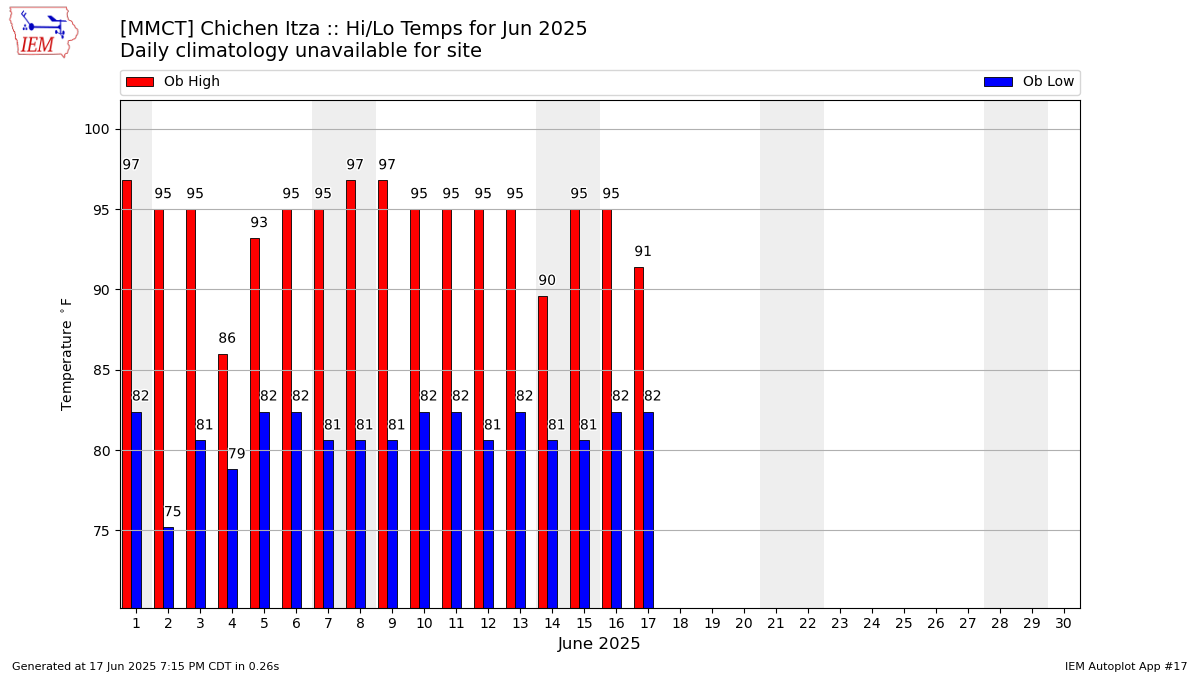
Average Daily High Temperature [F]
Year
Jan
Feb
Mar
Apr
May
Jun
Jul
Aug
Sep
Oct
Nov
Dec
2001
M
M
86.00
91.03
90.07
90.33
91.33
91.08
94.28
90.07
86.90
86.38
2002
84.92
84.05
87.70
93.98
95.17
89.44
91.85
94.88
89.18
88.97
85.46
82.44
2003
82.28
89.27
92.67
90.17
97.71
92.98
91.40
91.19
91.40
89.88
86.39
82.21
2004
M
86.00
M
M
M
91.04
87.29
86.64
90.80
85.51
83.87
81.40
2005
85.36
88.25
91.81
92.48
93.90
89.96
89.48
M
M
86.12
85.28
84.08
2006
83.90
81.35
84.40
88.34
90.65
87.29
87.05
87.20
88.40
86.00
80.60
81.89
2007
84.55
84.82
86.96
91.28
93.20
90.80
92.64
89.54
88.52
85.94
82.76
84.43
2008
84.20
87.24
87.45
91.16
94.54
88.82
90.18
93.08
90.62
84.49
78.80
81.95
2009
82.13
85.10
87.45
92.66
95.06
93.20
93.95
91.65
91.64
89.31
83.18
82.69
2010
79.96
80.79
85.19
91.16
92.50
93.68
88.03
89.60
88.76
85.88
84.26
78.68
2011
81.82
82.19
85.18
91.29
91.40
87.98
85.10
89.98
90.56
84.08
82.83
81.10
2012
81.63
84.70
89.06
89.18
89.95
88.22
88.55
88.55
90.20
86.58
82.58
85.30
2013
85.65
88.96
86.17
91.64
92.62
89.72
87.80
89.83
87.44
89.25
85.34
85.01
2014
81.35
87.29
90.24
94.04
91.98
91.22
93.43
92.85
89.60
87.63
82.88
84.14
2015
84.78
86.00
92.15
95.90
96.57
91.34
95.17
93.90
92.24
88.50
86.42
85.48
2016
82.75
83.70
89.77
93.56
97.03
93.38
93.08
91.69
92.30
90.35
89.00
89.08
2017
86.52
90.82
91.11
93.14
95.41
91.88
92.68
91.28
90.92
86.75
84.74
84.08
2018
81.06
90.18
91.17
92.12
91.17
89.30
92.45
91.11
91.58
90.35
87.86
85.01
2019
82.81
90.05
92.10
94.58
97.09
96.74
96.63
95.00
94.04
91.52
86.78
85.71
2020
84.72
88.42
92.68
98.24
M
M
M
M
M
M
M
M
2021
M
M
M
M
M
M
M
M
M
M
M
M
2022
M
M
M
99.32
92.27
90.44
92.45
90.82
89.06
87.86
87.44
85.30
2023
87.10
86.06
90.24
93.62
95.64
94.82
93.49
92.33
92.30
90.41
87.08
80.02
2024
83.85
84.39
93.14
94.94
99.41
92.36
91.34
91.92
90.50
85.54
85.34
81.41
2025
82.05
86.58
89.77
91.16
94.77
94.33
M
M
M
M
M
M
Average Daily Low Temperature [F]
Year
Jan
Feb
Mar
Apr
May
Jun
Jul
Aug
Sep
Oct
Nov
Dec
2001
M
M
78.80
58.15
56.15
60.22
63.84
64.40
62.57
67.80
56.31
52.94
2002
54.40
55.00
47.05
48.86
53.58
53.07
51.60
53.06
59.22
46.75
54.97
55.23
2003
50.88
45.18
62.63
64.20
58.13
50.80
49.47
54.12
50.40
55.93
54.39
62.24
2004
M
75.20
M
M
M
89.24
86.51
85.61
90.65
84.53
82.07
81.00
2005
73.40
76.10
78.10
76.76
79.96
78.86
79.73
M
M
76.16
75.38
75.55
2006
73.22
80.90
81.40
84.74
89.45
85.23
84.50
86.60
86.00
86.00
80.60
81.37
2007
75.26
73.01
77.13
76.04
79.67
79.16
79.92
78.80
78.50
76.94
75.68
75.43
2008
72.24
76.44
78.57
78.14
81.12
79.28
78.80
79.79
79.52
76.30
77.36
81.05
2009
74.33
73.72
77.17
78.02
80.37
80.66
80.08
80.04
80.12
79.32
75.20
74.91
2010
70.61
70.38
72.82
76.10
80.60
81.44
78.86
80.60
80.02
77.41
77.18
71.90
2011
73.59
79.22
79.54
86.64
85.23
85.10
82.50
83.63
79.58
75.32
75.37
74.02
2012
71.92
73.96
78.02
75.56
77.35
78.32
78.22
78.51
78.14
76.65
74.36
73.69
2013
76.54
76.94
74.74
77.96
79.38
77.90
77.23
79.38
77.12
78.28
77.60
76.42
2014
71.95
76.61
78.92
80.72
80.25
80.18
80.54
80.89
79.04
78.45
75.44
74.56
2015
73.75
74.43
80.48
81.44
82.23
80.36
81.76
81.06
80.54
79.09
78.74
78.57
2016
71.72
73.90
80.02
80.06
83.04
80.90
81.18
80.60
80.78
78.28
81.32
78.57
2017
74.74
75.26
75.84
75.86
77.99
78.98
78.22
78.86
78.02
74.91
73.64
71.08
2018
66.43
73.34
74.45
73.04
74.62
77.30
76.54
76.42
77.12
77.58
76.82
72.53
2019
68.93
73.85
75.61
77.36
80.66
81.50
79.55
79.26
78.08
78.10
76.28
71.66
2020
70.55
72.97
77.35
78.15
M
M
M
M
M
M
M
M
2021
M
M
M
M
M
M
M
M
M
M
M
M
2022
M
M
M
81.95
74.74
74.36
75.08
75.55
74.84
74.11
75.20
71.77
2023
70.15
70.89
74.21
78.20
80.19
80.42
79.61
78.80
79.04
78.34
76.22
70.21
2024
69.97
66.20
75.55
78.74
83.74
80.00
79.09
79.32
79.16
76.48
73.82
68.23
2025
67.59
70.89
72.82
76.40
80.43
80.94
M
M
M
M
M
M
Average Daily Temperature (high+low)/2 [F]
Year
Jan
Feb
Mar
Apr
May
Jun
Jul
Aug
Sep
Oct
Nov
Dec
2001
M
M
82.40
74.59
73.11
75.27
77.59
77.74
78.43
78.94
71.60
69.66
2002
69.66
69.52
67.37
71.42
74.38
71.26
71.73
73.97
74.20
67.86
70.22
68.84
2003
69.32
66.18
77.27
76.21
76.54
71.62
66.51
67.05
67.70
69.25
70.28
71.56
2004
M
80.60
M
M
M
90.14
86.90
86.13
90.72
85.02
82.97
81.20
2005
79.38
82.17
84.95
84.62
86.93
84.41
84.61
M
M
81.14
80.33
79.82
2006
78.56
81.13
82.90
86.54
90.05
86.26
85.78
86.90
87.20
86.00
80.60
81.63
2007
79.90
78.92
82.05
83.66
86.44
84.98
86.28
84.17
83.51
81.44
79.22
79.93
2008
78.22
81.84
83.01
84.65
87.83
84.05
84.49
86.44
85.07
80.40
78.08
81.50
2009
78.23
79.41
82.31
85.34
87.71
86.93
87.02
85.84
85.88
84.32
79.19
78.80
2010
75.29
75.59
79.00
83.63
86.55
87.56
83.45
85.10
84.39
81.65
80.72
75.29
2011
77.71
80.71
82.36
88.96
88.31
86.54
83.80
86.81
85.07
79.70
79.10
77.56
2012
76.77
79.33
83.54
82.37
83.65
83.27
83.39
83.53
84.17
81.62
78.47
79.50
2013
81.09
82.95
80.45
84.80
86.00
83.81
82.52
84.61
82.28
83.76
81.47
80.72
2014
76.65
81.95
84.58
87.38
86.12
85.70
86.99
86.87
84.32
83.04
79.16
79.35
2015
79.26
80.21
86.32
88.67
89.40
85.85
88.47
87.48
86.39
83.79
82.58
82.02
2016
77.23
78.80
84.90
86.81
90.04
87.14
87.13
86.15
86.54
84.32
85.16
83.82
2017
80.63
83.04
83.47
84.50
86.70
85.43
85.45
85.07
84.47
80.83
79.19
77.58
2018
73.75
81.76
82.81
82.58
82.89
83.30
84.49
83.76
84.35
83.97
82.34
78.77
2019
75.87
81.95
83.85
85.97
88.87
89.12
88.09
87.13
86.06
84.81
81.53
78.68
2020
77.64
80.69
85.01
88.20
M
M
M
M
M
M
M
M
2021
M
M
M
M
M
M
M
M
M
M
M
M
2022
M
M
M
90.64
83.50
82.40
83.76
83.18
81.95
80.99
81.32
78.54
2023
78.63
78.48
82.23
85.91
87.92
87.62
86.55
85.56
85.67
84.37
81.65
75.11
2024
76.91
75.29
84.35
86.84
91.57
86.18
85.22
85.62
84.83
81.01
79.58
74.82
2025
74.82
78.74
81.30
83.78
87.60
87.63
M
M
M
M
M
M
Average Relative Humidity [%]
This value is computed via a simple average of available observations weighted
by the duration between observations.