Past IEM Features tagged: awos

86°F Ames Dew Point
31 Jul 2026 05:30 AMToday's feature continues the recent series looking into the record setting dew point temperatures from earlier this week. Dew point extremes are not an official climate metric tracked by the National Weather Service, so entities like the IEM create period of record statistics based on hourly observations. So while there is no official Iowa dew point temperature record, discussions with various Iowa climate experts have often concluded that 87°F on 13 Jul 1995 for Cedar Rapids is it. Three airport weather stations reported maximum dew point temperatures above 87°F earlier this week, but yesterday's IEM feature attempted to explain those away as just bad data / poor sensor performance. Today's featured chart takes another look into one of the problematic maximum dew point readings (Algona). It is compared with a nearby ISU Soil Moisture station (Kanawha) and the Ames airport station over Sunday and Monday. Ames reported a maximum of 86°F, so it is good to inspect the three time-series to see if the patterns make sense. Two areas are shaded each day as informative times to observe temperature and dew point changes. The light red area (7 AM - noon) represents a period of increasing net radiation and vertical air mixing. The light blue area (6-8 PM) often represents a period of stabilization as air temperatures start to decrease but evapo-transpiration may still be on-going. The top two subplots present coherent depictions of increasing day time temperatures allowing for a vapor pressure deficit that can support evapo-transpiration increasing the dew point. For the second day, a drier air mass was working its way into Iowa during the afternoon hours and you can see rather poor sensor performance at the Algona site vs nearby Kanawha. The Ames 86°F reading appears to be associated with the aforementioned early evening brief period with on-going transpiration and reduced vertical mixing. The "Generate This Chart" button takes you to the ASOS one minute plotting tool for Ames, which provides some more clues to what drove the 86°F dew point.
Voting:
Good: 17
Bad: 0
Abstain: 1
Tags: awos dewpoint jul26

About Those 90°F Dew Points
30 Jul 2026 05:30 AMIt is a tale as old as time, it seems. For the most humid days of the summer, a couple of the non-federal airport weather sensors in Iowa will report incredible dew point readings, often reaching the low 90s°F. "Corn sweat" is immediately attributed to these without much considering if such readings are even physically possible. The next level of attribution claims that these sensors are located within corn fields, so they are sensing the corn field environment and since Iowa is mostly covered by corn and soybean fields, that this reading, while high, is still representative of the state. So like what the IEM did back in August 2023, today's feature attempts to simply explain those high readings as bad data / poor sensor performance. There are three main airport weather station network types with Iowa. The "Federal ASOS" sites maintained by the FAA/NWS. The "Federal AWOS" sites maintained by the FAA. The "Non-Federal AWOS" sites that are operated by the Iowa DOT. These sites have different sensor packages, siting requirements, and maintenance methods. While a number of ASOS sites set dew point records earlier this week, a few AWOS sites reported even higher dew point temperatures in the upper 80s and even low 90s. The featured chart presents some humidity metrics over the past most humid days with the colors representing the network type that the airport weather station belongs to. Some logical and charted points to why such high dew points are bad.
- The 90°F dew point club (Clarion, Algona) are clearly having a problem with reporting too high of relative humidity (RH) and often "stuck" at 100% (first column). They are also reporting way too high RH during the afternoon hours (last column) vs all other sites over Iowa.
- The high RH frequencies, if accurate, would also imply reduced crop transpiration as saturated air can not take on more water vapor. This creates a conundrum for the theory that "corn sweat" can drive such high dew points when the sensor indicates high RH already.
- Ultimately, the very high dew points are just a sign of the sensor struggling to accurately measure humidity under extreme humidity levels. There is likely some water condensation within the sensor causing it to over-report humidity.
Recapping, "corn sweat" certainly drives higher dew point temperatures in Iowa and the effect is nicely documented with this Wolf and Market article. The effect can only push dew point temperatures so far into the lower 80s.
Voting:
Good: 24
Bad: 1
Tags: awos

Bad 90 Degree Dew Points
22 Aug 2023 05:33 AMIn the why we can't have nice things department, the weather world was abuzz yesterday about a number of airport weather stations in Iowa that reported upper 80s and even low 90 degree dew point temperatures. Sadly, the reporting mechanisms lump most of the airport data into one data stream that mixes federally maintained (FAA/NWS) ASOS airport weather stations in with the state maintained (Iowa DOT) AWOS stations. Folks rightly assume that all airport data is created equal, but it is not. Unfortunately, siting, maintenance, sensor packages, and aspiration differences can yield big differences in reported weather variables. The featured chart compares a temperature and dew point time series for three sites in the state. The Denison AWOS (lower panel) was one of the aforementioned sites that hit 90+ for a dew point and the immediate hand-waving explanation for the data being valid is "corn sweat". The other two sites were chosen as sites also in close proximity to agricultural fields, but yielded a different depiction of peak afternoon dew points. Two important times of the day are highlighted to point out physical processes happening. To start off the morning hours, we are at 100% humidity with likely lots of dew and even some fog. The sun rises and heating of the ground and plants ensue, this produces a demand from the air for water that may be available and also the plant is wishing to start transpiring with its activity, dew is also being evaporated. So the temp and dew point separate a bit, but both are rising. By the afternoon, only transpiration is usually left and temperatures are quite warm with good mixing of the lower atmosphere, it is difficult to increase humidity levels during this time. By early evening (blue area), mixing decreases and humidity levels can make one subtle push higher before stabilization happens and air temperature and dew point starts to both slowly work downward. Having 100% relative humidity like Denison does throughout the day is a tell-tale sign of a sensor problem and not depicting what is happening in/near agricultural fields in the state. Yes, "corn sweat" (and soybeans too) contributes a number of degrees to the dew point temperature this time of year, but is not able to push it much higher than the lower 80s. As temperatures warm into the 90s and absolute humidity increases, plants will cut back to conserve water and dew points can't simply keep increasing with the temperature.
Voting:
Good: 26
Bad: 2
Tags: awos

Unreliable Dew Points
21 Jul 2011 12:33 AMOur recent stretch of extremely hot and muggy weather has gotten Iowa a bit of publicity as some of our automated stations have calculated heat indexes that exceeded 130 degrees! Typically, this is blamed on the abundant transpiring corn crop in the state, but that is not the entire story. The primary source of automated weather data in the state are located at airports, but there are two classes of instruments. The federally administered ASOS sites have higher quality and sometimes different sensors than their state run AWOS counterparts. Unfortunately, their data is typically thrown together in the same pot and reported as such. While the ASOS sites did indicate gaudy heat indexes exceeding 110 at times, they were not as high as the AWOS sites which got all the headlines. The featured chart presents a comparison of an ASOS and AWOS site separated by 30 some miles and both surrounded by farm fields. The bottom plot raises the most doubt as even while visibilities were at 2-4 miles, relative humidity was just 75% at the AWOS site and near 100% at the ASOS site. This is probably an indication that the AWOS air temperature has a warm bias. The second plot shows another issue of having the AWOS dew point rise dramatically during the morning hours at a much higher rate than the ASOS site. It is hard to imagine a natural process that could be putting that much water into the atmosphere in the early morning hours. The first plot of the ASOS site shows a reasonable depiction of transpiring corn (slowly rising dew point throughout the day peaking late afternoon coinciding with plant transpiration), but the dew point temperature barely gets to 80 degrees which keeps the calculated heat index at reasonable values. The moral of the story is that not all automated sensors are alike and while heat indexes over 110 surely were felt in Iowa these past days, the high end values over 120 are questionable.
Voting:
Good: 54
Bad: 5
Tags: awos heatindex dewpoint
Not Physical
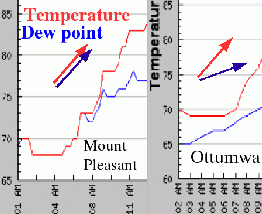
08 Jun 2004 08:47 AMThis plot shows temperature and dew point traces from Mount Pleasant (MPZ) and Ottumwa (OTM) Monday morning. The MPZ plot depicts an early morning scenario that is hard to believe. It is nearly impossible to have 100% humidity while the temperature warms 9 degrees in the early morning from solar insolation. If it was truely that humid in the lower boundary layer, the sun would have had a tough time mixing down the moisture quick enough to maintain saturation with an increasing air temperature. This is not physical and indicates bad data.
Tags: awos