Past IEM Features tagged: freeze
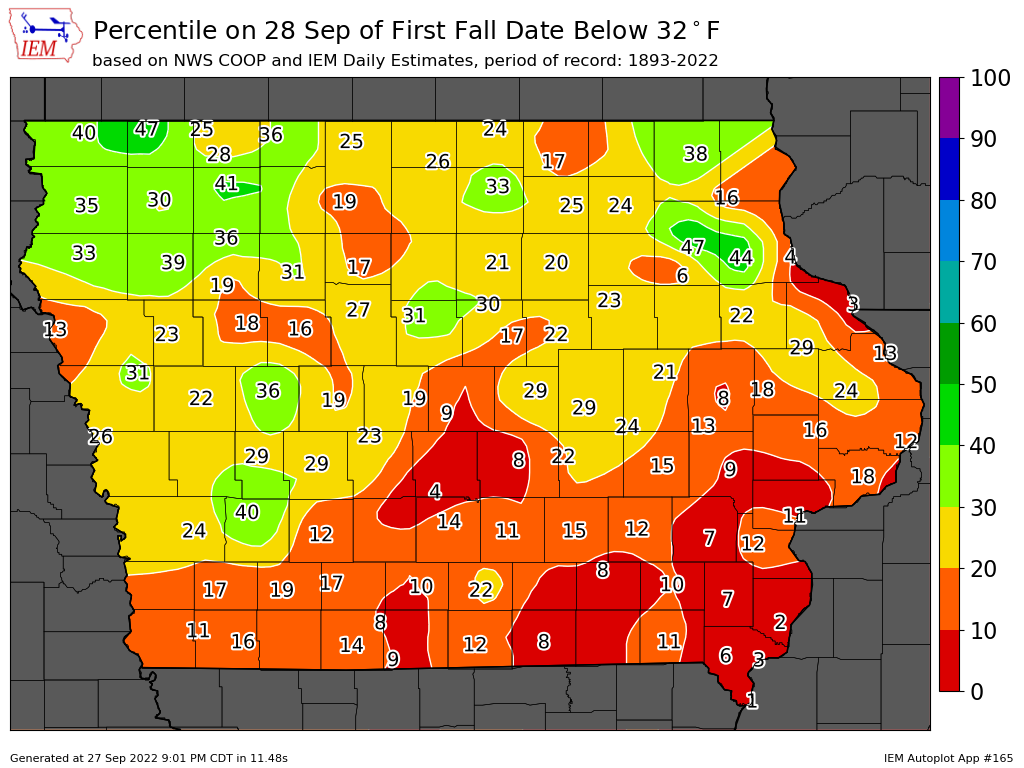
September 28th Percentiles
28 Sep 2022 05:32 AMClear skies and low humidity levels have allowed temperatures to really drop this Wednesday morning. The NWS has a frost advisory for almost the entire state with temperatures presently near or just below freezing, which makes for the first freezing temperatures of the season. September 28th is a bit early for such temperatures as shown by the featured map. It presents the percentile / percentage of years whereby a given site has seen a sub 32 degree temperature by today's date. For example, the Ames value of 9 represents just 9 percent of previous years on record having had such a cold temperature by today. So only the notoriously cold portions of the state in NE Iowa, NW Iowa, and the Nishnabotna River Valley have values in the 30 to 40% range. The big question is how much damage to the crops will this freeze cause. It depends on many factors including the maturity of the crop, how long temperatures were below freezing and how far below freezing the temperatures got.
Voting:
Good: 13
Bad: 0
Tags: freeze

Plenty of Days Possible to Freeze
02 Apr 2021 12:01 AMIt happens most every early April. The grass starts to green up, we just some rains to mellow out the frozen ground, the lengthening days and increasing sunshine energy makes us believe that perhaps the freezing temperatures are behind us and we are free to start planting things. While the near term forecast looks great for warm temperatures, climatology tells us that we have plenty of days yet to go before the possibility of a freeze becomes very small. The featured chart presents the percentage of years that had at least a given threshold temperature on or after the date shown. These values are presented for four different thresholds. For the first day of April, almost 90% of years experienced a sub 29F temperature after this date for that year. One has to wait about two weeks before that threshold reaches 50% frequency.
Voting:
Good: 14
Bad: 0
Tags: freeze

First Fall Freeze
25 Sep 2020 05:34 AMThe featured map presents an IEM analysis of average first fall date with a low temperature below 32 degrees Fahrenheit based on long term climate sites. The 'X' marks on the plot denote locations that have had such a cold temperature so far this fall season. The map shows average dates in Iowa ranging from 27 September to 17 October. The map nicely shows some climatological features of our region with the earliest dates found over the high plains and northern tier of states. The warmth effects of the Great Lakes is noticeable as well with dates coming later the closer you get to the water. Our first chances of a freeze look to arrive once the calendar nears October with an end to our current stretch of warm weather.
Voting:
Good: 21
Bad: 0
Tags: freeze

Freezing Temps Coverage
20 Oct 2017 05:34 AMFreezing temperatures have been difficult to come by so far this fall season. The featured chart looks at the areal coverage percentage of fall freezing temperatures. The percentages represent the amount of area that has seen at least one day with sub freezing temperatures. The blue line is the average coverage based on data back to 1893. The largest and smallest coverage are shown as well along with the accumulation for this year and last. This analysis puts this year at 25%, which would be average for the end of September. It is interesting to see this year mimic 2016 with the late start to sub freezing temps.
Voting:
Good: 10
Bad: 1
Abstain: 1
Tags: freeze
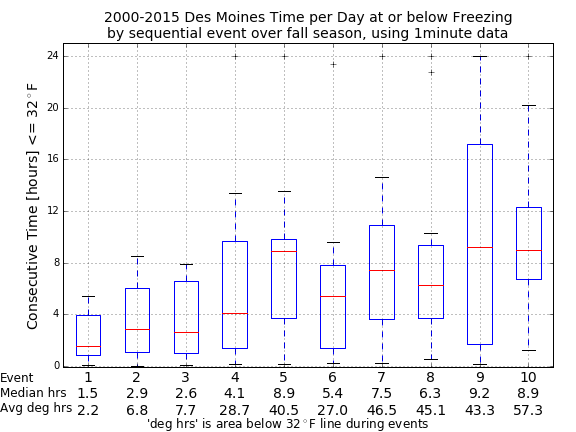
Freezing Time
21 Oct 2016 05:34 AMThe featured chart presents an analysis of duration and strength of the first fall periods at or below freezing for Des Moines based on one minute interval temperature observations since fall 2000. Each event represents a sequential fall date during which the low temperature reached 32 degrees or colder. For example, event three would be the third day during the fall season at or below 32. The time duration is the period between when the temperature hit 32 degrees and rose back above 32. The maximum duration period for each date was used in cases of multiple periods on a given date. The box and whisker plots represent the spread of duration. A strength metric is also calculated and is simply the temperature difference from 32 multiplied by time. So what is the moral of the story here? The initial dips below freezing are brief (1.5 hours on average) and shallow. Both the duration and "depth" increase with sequential event with more noise than signal appearing after the fourth or fifth event.
Voting:
Good: 7
Bad: 2
Tags: freeze fall

Hard Freeze Clouds
14 Oct 2016 05:34 AMFreezing temperatures finally arrived in Iowa on Thursday with some locations, like Ames, even reaching sub 29 degrees. Cloudy conditions on Wednesday gave way to clear skies overnight, which greatly helped the atmosphere cool off. Do skies always need to be clear on the first fall occurrence of sub 29 degree temperatures? The feature chart looks at the hourly sky coverage as reported by the Ames Airport for the 24 hour period before and after the first sub 29 degree temperature event. All but two years since 1996 are indicated to be clear skies at the time of sub 29 (denoted as 0 hour on x axis).
Voting:
Good: 10
Bad: 1
Tags: freeze clouds

Last Hard Freeze
08 Apr 2016 05:34 AMVery chilly air is filtering into Iowa today and is expected to push temperatures well below freezing tonight. With temperatures below 29 degrees Fahrenheit, a hard freeze is expected. Is having such an event during the second week of April uncommon? The featured map displays the average date of last sub 29 degree low temperature for the spring season over the Midwest based on period of record data. Of course, the further south you go, the longer past average date this event would be.
Voting:
Good: 15
Bad: 1
Tags: freeze frost

Stretches below Freezing
10 Nov 2014 03:04 AMThe highly anticipated week of cold weather is set to arrive with significant snowfalls forecasted to our north over Minnesota and Wisconsin. It would appear that the temperature may be below freezing for a few straight days this week for parts of the state. The featured chart presents the longest streak of days with the high temperature below 32 degrees for Ames. For early November, a few days is about the most that can be expected and is nothing out of the ordinary. The maximum streaks get longer as we get deeper into winter.
Voting:
Good: 16
Bad: 7
Abstain: 7
Tags: freeze

Days till killing frost
13 Oct 2014 05:47 AMThe coldest air of the season visited Iowa this past weekend with many locations reaching their first sub freezing temperature on Saturday morning. For Ames, the temperature bottomed out at 31 degrees. The featured chart presents the number of days from the first sub freezing temperature until the first sub 29 degree temperature which is considered a killing frost. The slanted grid lines simply allow you to see the date that the dots fall on. So for having the first freeze on 11 October, we've previously waited up to 20 some days for the killing frost.
Voting:
Good: 12
Bad: 11
Abstain: 6
Tags: freeze
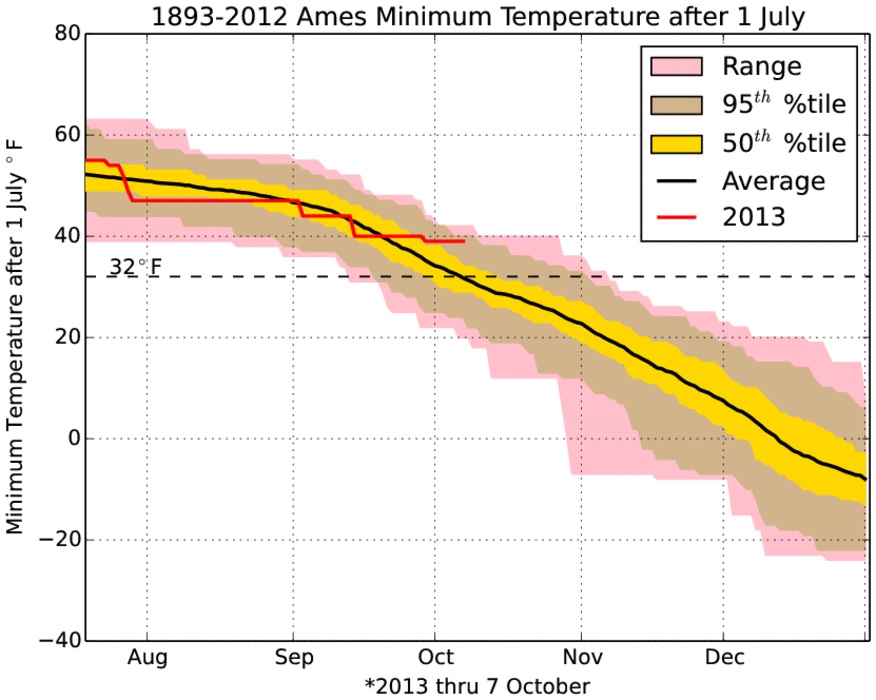
No freeze yet
08 Oct 2013 05:37 AMThis is about the time of year by which much of Iowa has experienced its first freezing temperature. The featured chart presents the year to date lowest temperature after 1 July climatology for Ames. While not strictly the same metric, the intersection of the black line (average lowest temperature to date) and dashed line (freezing temperature) around this time approximately matches the average first freezing temperature of the fall. The minimum to date temperature for this year shows that we are well on the warm side of long term average. The shaded areas represent the percentile ranges of 50% and 95% of the daily data. The red line should remain flat for at least the next seven days with low temperatures well above 40 degrees.
Voting:
Good: 46
Bad: 16
Tags: fall freeze low

Freeze Progression
19 Sep 2012 05:56 AMMonday morning saw our coolest temperatures of the season so far with some very limited areas seeing temperatures at or just below freezing. The featured chart presents an IEM computed analysis of the areal fraction of the state that has experienced a temperature below 32 degrees prior to a given date. 2012 has yet to appear on this chart as the freeze area was negligible yesterday. The longer term averages are computed over two periods for comparison. The two hot and dry summers of 1988 and 1936 are shown as well for comparison. It is certainly the time of year to start seeing freezing temperatures in the state.
Voting:
Good: 39
Bad: 7
Tags: freeze

Freezing everyone
19 Oct 2011 05:59 AMThe featured chart presents an IEM estimate of the areal coverage of Iowa that has experienced its first fall season sub-freezing temperature. The blue line is the simple average of the previous 60 years with the red and green line being the previous two years. The first two weeks of October are typical for having the first frost of the year with the warmer parts of the state lasting longer into October. It appears likely that the rest of the state yet to experience a freeze will see it in the coming days with very cold air settling into the state.
Voting:
Good: 21
Bad: 1
Tags: freeze

Growing Season ends for some
15 Sep 2011 07:16 AMVery chilly air for this time of year settled into Iowa over night and morning low temperatures were below freezing for most of those in the northern half of the state. Our bout with cold air will be brief as chances of rain are in the forecast along with lows well above freezing.
Voting:
Good: 10
Bad: 7
Tags: freeze 2011

High temperature streaks
11 Feb 2011 05:53 AMThe forecast holds a great deal of optimism for a streak of at least a week of above freezing daily high temperatures this would follow a period of 12 days with highs at or below (AOB) freezing. The featured chart looks at the longest streaks of having daily highs AOB freezing and then having them above freezing. There are two dots presented for each year denoting the longest streak on each side of the regime change. One of the interesting outliers in this plot is what happened last spring. After a period of 37 days below freezing, temperatures warmed on 2 March and we had 265 straight days of high temperatures above freezing. So the longest streak of 37 days was followed by a streak of 265 days. The crosses represent the longest second part of the streak and what the streak was below freezing before that streak. Kind of confusing, so please comment if this does not make any sense!
Voting:
Good: 32
Bad: 15
Tags: high freeze

Key Fall Temperatures
29 Sep 2010 05:08 AMNearly all of Iowa has probably not seen sub freezing temperatures yet this fall. The featured chart displays the date of the first sub freezing temperature for Ames along with the number of days afterwards until the first sub 29 degree temperature (typically considered the killing frost). A value of zero days would imply that the first day of sub freezing temperatures also dipped below 29. A final delineation is also provided with the size of the dots representing Jun/Jul/Aug precipitation with red dots being those years above 18 inches, like this year. The earliest freeze shown on this chart was in 1902, even after a wet summer. As for this year, our first good chance for a freeze is expected to arrive this weekend.
Voting:
Good: 14
Bad: 12
Tags: freeze

A bit frosty for May
10 May 2010 05:10 AMClear skies and calm winds helped temperatures to drop to frosty levels Sunday morning as shown by the featured IEM analysis of low temperatures. The full impacts of this cold event will take a bit to be determined, but the corn crop was probably not far enough developed to be significantly impacted. Trees and flowers took the brunt of this cold weather with more cool weather expected this week. The big story will be the heavy rainfall along with highs only in the 50s for the next few days.
Voting:
Good: 29
Bad: 2
Tags: may10 freeze
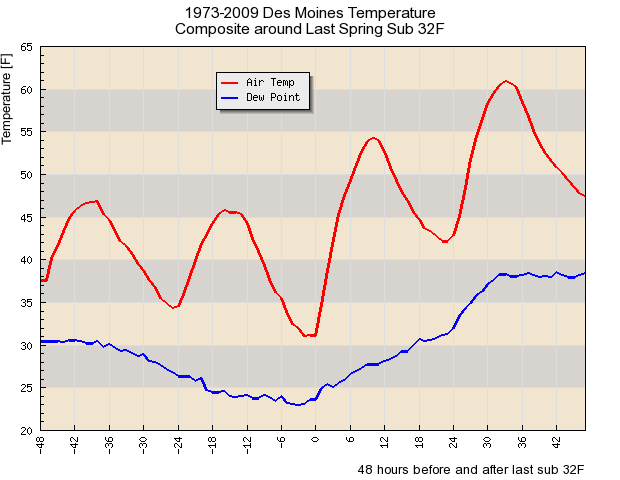
Before and after the final freeze
28 Apr 2010 05:10 AMTemperatures in some locations this morning in eastern Iowa are hovering around freezing, but the rest of the state looks to miss out thanks to a slight southerly breeze and higher dew points. The featured chart presents a composite of air temperature and dewpoint for the 96 hours around the final sub 32F temperature measured at the Des Moines Airport. The plot perhaps indicates the importance of having low dew points for the period up until the cold temperature. The dry air helps the atmosphere to cool off efficiently, allowing temperatures to drop in the early morning hours (-6 to 0 hour). The moisture increase thereafter is probably showing the effect of having a high pressure system pass to the east and southerly flow returning.
Voting:
Good: 24
Bad: 12
Tags: freeze

Preferred Location
30 Sep 2009 06:04 AMLow temperatures this Wednesday morning dipped into the 30s over parts of the state. The featured map displays the frequency of a long term climate site having the first fall sub freezing temperature (ties are shared). The map displays three preferred locations for the first fall freeze: Northwest Iowa, Northeast Iowa, and Westcentral Iowa in the Nishnabotna Valley (Atlantic is the site at 15).
Voting:
Good: 33
Bad: 3
Tags: freeze
Before the first freeze
24 Sep 2009 06:08 AMThe featured chart shows the frequency of low temperature thresholds for the fall period before the first freezing temperature. For instance, on average we would expect to see around 10 days with a low temperature at or below 45 degrees before the first freeze (blue dots). The maximum and minimum values are shown as well along with the current observation this fall. The moral of the story is that we probably should see a few more cool mornings before the first freeze with a day or two in the 30s and then finally that first fall freeze.
Voting:
Good: 25
Bad: 7
Tags: freeze climate
First Freeze and Full Moons
05 Sep 2009 11:22 AMIt is commonly said that the first fall season freeze occurs during a full moon in late September or October. The featured plot shows that this simply is not the case in Iowa. The horizontal axis contains the number of days from the nearest full moon and the vertical axis is the number of days that observation was from the 6th of October (the median first freeze date). The contours indicate the relative frequency of the data. The important portion of the plot is the histogram in red at the top of the page clearly showing no full moon date dependence. Here is an Excel file with this data.
Voting:
Good: 20
Bad: 7
Tags: climate moon freeze
Freeze/Thaw Days
16 Mar 2009 06:07 AMThe featured chart presents the frequency of having a daily high temperature above freezing with a low temperature below freezing for Ames. The chart shows two seasonal maximums in late fall and early spring. Our weather this week looks very warm to start with values returning to near average by the end of the week.
Voting:
Good: 17
Bad: 7
Tags: freeze thaw
Getting below freezing
17 Oct 2008 06:19 AMThe featured plot is from the Humbolt SchoolNet for Thursday morning showing the flat lining in temperature around freezing before more cooling occurs just before sunrise. You will often see this as special processes occur when water begins to freeze, which releases heat and therefore slows the cooling process some. Having the dew point near 32 degrees gives an indication that frost formation was a necessary process for the temperature to cool below freezing.
Voting:
Good: 39
Bad: 21
Tags: freeze

The chances for frost
03 Oct 2008 06:37 AMThe featured chart shows the percentage of years since 1893 that a certain temperature threshold was exceeded by a certain date in the fall for the Ames climate site. For instance, the chance (observational frequency) of a sub-33 temperature by this time of year is roughly 50%. This means half of the years prior to this one have seen a sub-33 temperature by October 4th.
Voting:
Good: 42
Bad: 24
Tags: freeze climate
Before the first 32
09 Sep 2008 06:37 AMThe featured chart is a temperature composite of the time period before and after the first sub 32 degree temperature in the fall from the Des Moines Airport. The three lines represent the temperature range and average of the observations 3 days before thru 1 day after the event. The 12 hours before the first event show a rapid cooling which is often the case with clear skies during the night time hours. Those clear skies are then typically around for the next day when temperatures quickly recover.
Voting:
Good: 23
Bad: 4
Tags: fall freeze